Admin Console quickstart
This 10-minute walkthrough covers the essential Admin Console tasks for a Fully Managed deployment: confirming the default project endpoint, reviewing model and provider access, managing user accounts, and monitoring organization-wide usage and audit history.
Names, email addresses, and network addresses in the screenshots are example values. The Admin Console URL takes the form dashboard.<custom-name>.tetrate.ai, and it differs between production and non-production deployments.
Step 1: sign in
-
Go to the Admin Console URL.
-
Sign in through single sign-on (SSO).

-
Click Sign in with Corporate SSO to authenticate through the corporate identity provider.

-
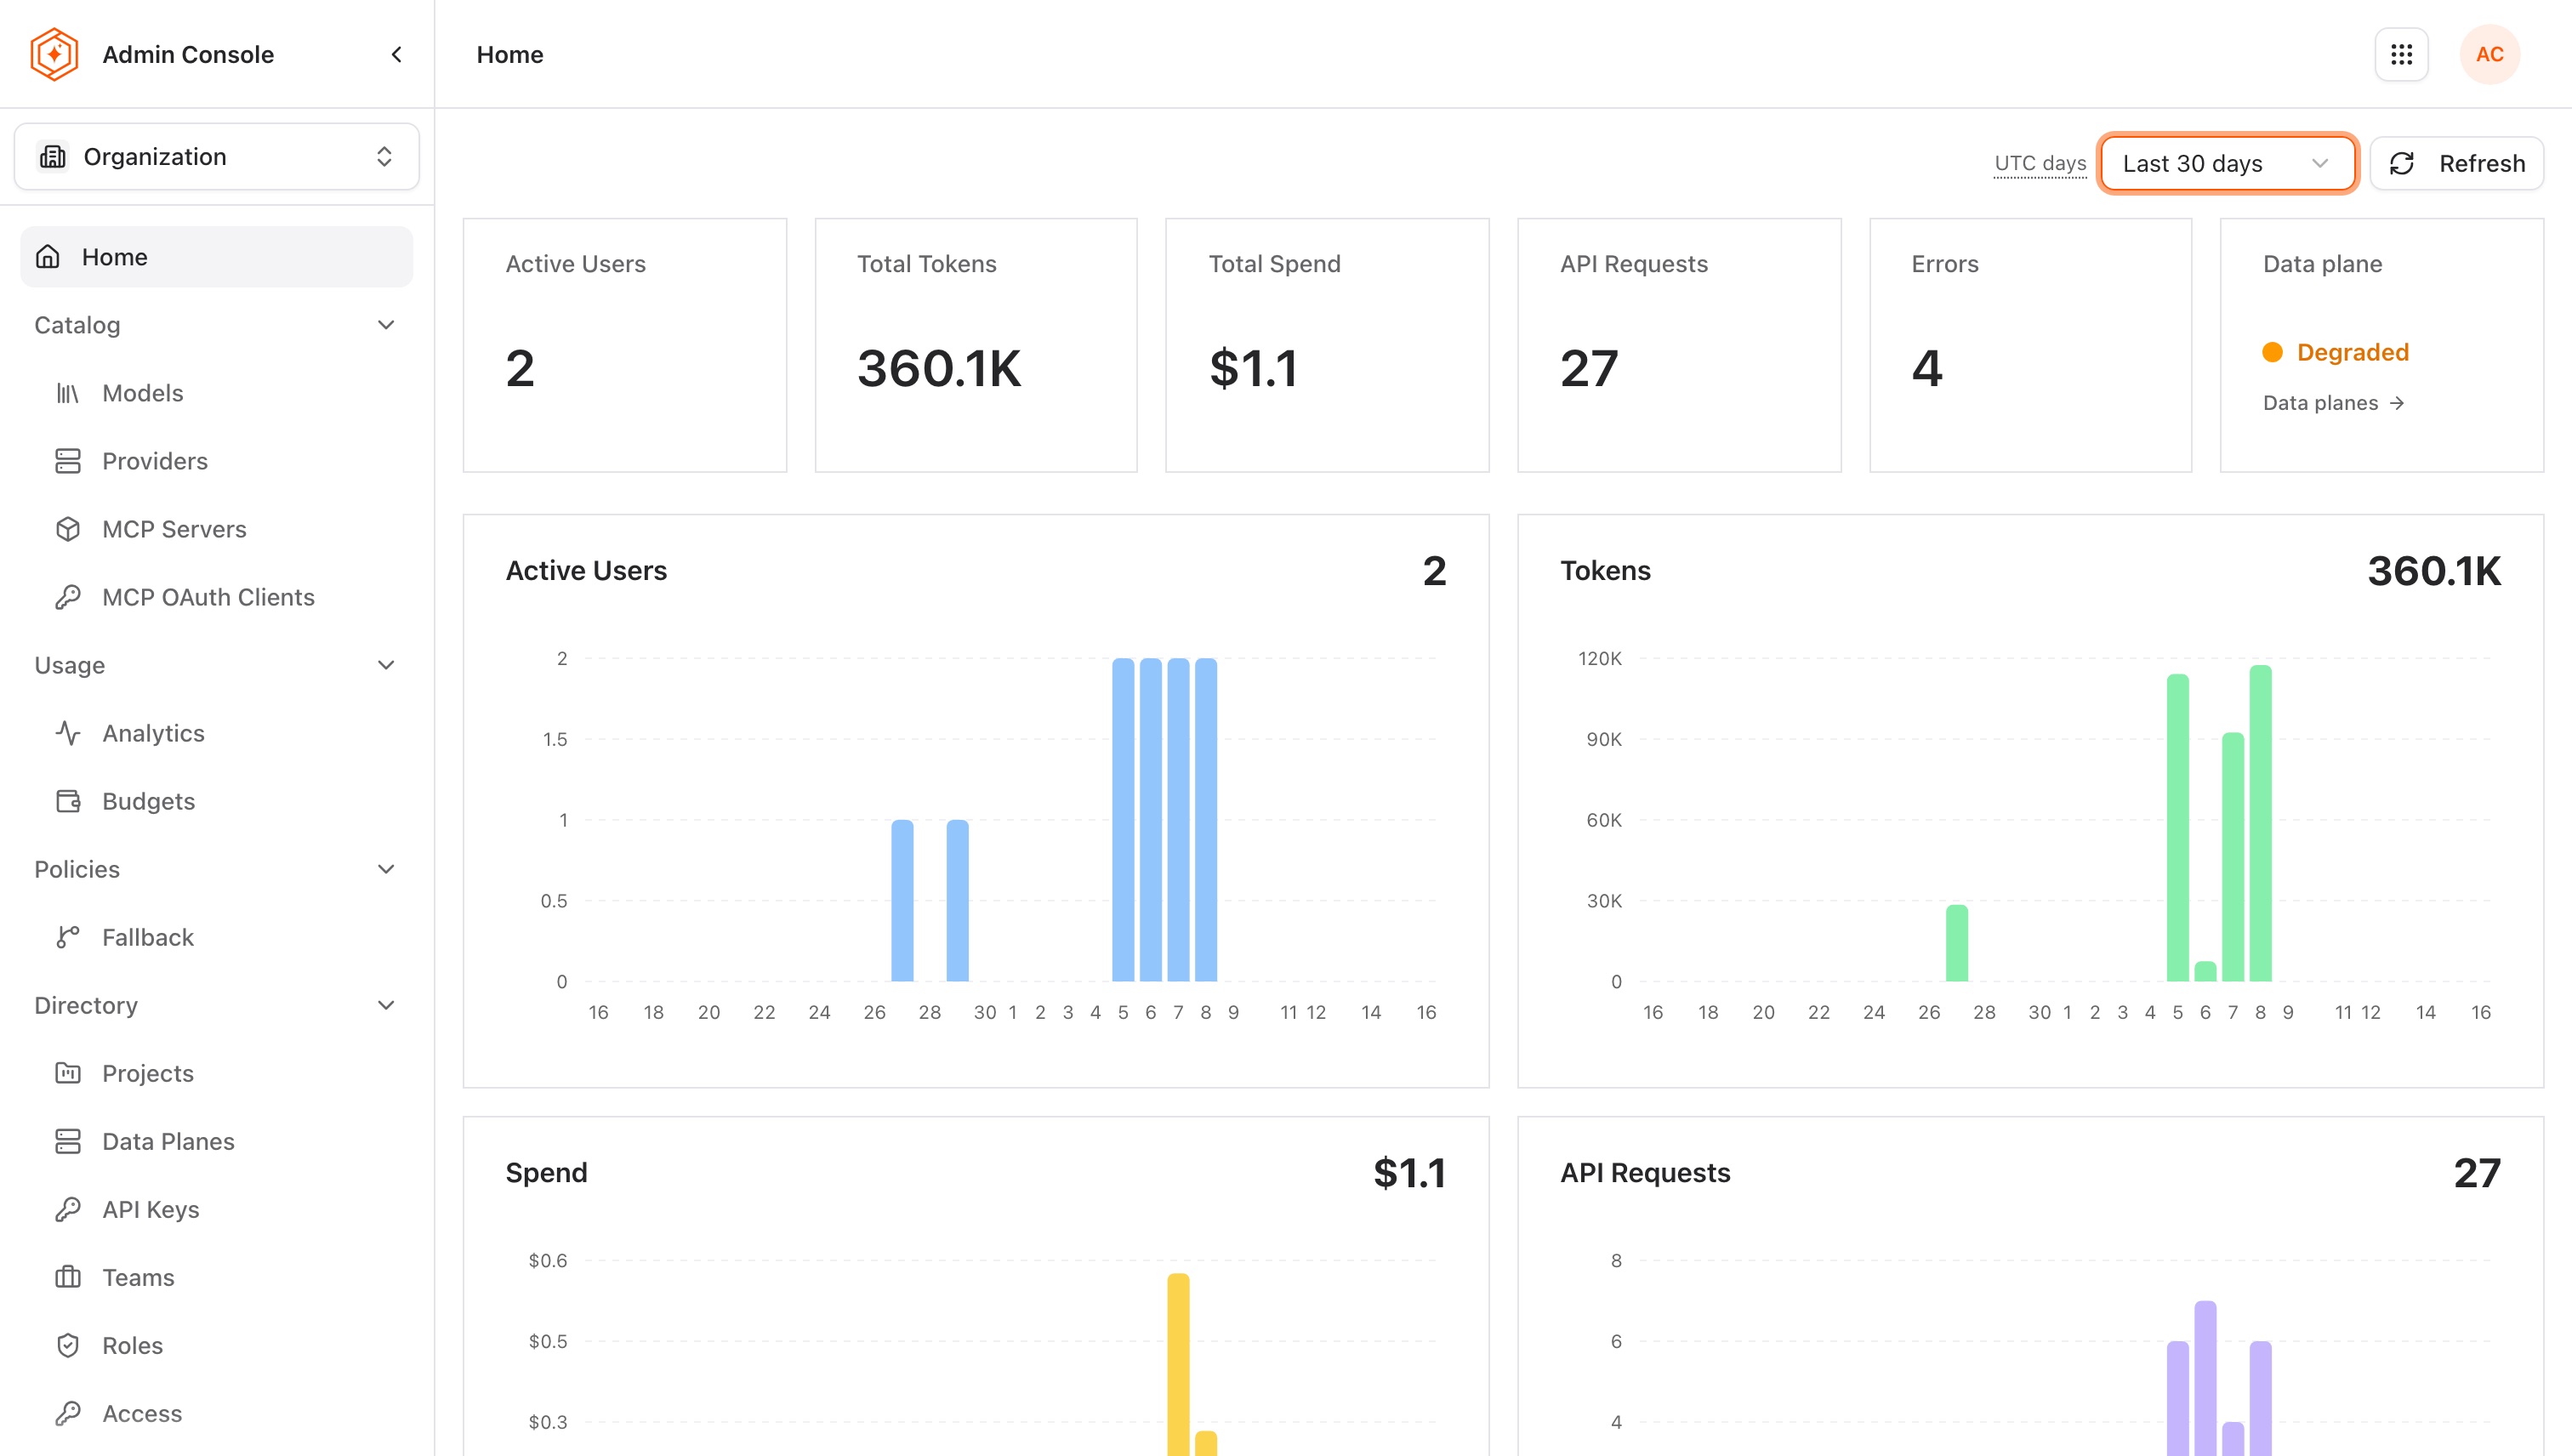
The landing page is Home, showing an Tetrate Agent Router-level overview for the selected time range: active users, total tokens, total spend, API requests, errors, and data plane health, each with a chart.
Step 2: confirm the default project is ready
Fully Managed deployments include a Tetrate-operated data plane. Onboarding sets up the default project automatically, so the managed data plane is labelled with the project, and the provider(s) connected and the models selected are already in place. Project membership is the one exception: it comes only from the onboarding wizard's Admin email field. A quick look confirms all of it before developers create keys or send traffic:
-
Open the project selector and choose the default project.
-
Open the project's Data Planes tab and confirm the managed data plane is listed with the address Tetrate assigned for the deployment, for example
https://proxy.<tenant>.tetrate.ai, and that it reports it has served the project. The data plane reports the address itself, so there is nothing to configure. One data plane can serve several projects; this tab lists the data planes serving the default project. -
Confirm the administrator account is listed as a project User. If it is missing (the Admin email field was left blank during onboarding), add it with Grant access.
-
Confirm at least one provider is connected and enabled for the project.
-
Open the project-scoped Models page and confirm the models developers should call are linked and enabled.
Do not generate, rotate, or revoke a data-plane service-account credential from the Admin Console for a Fully Managed deployment. Each of those actions revokes the credential the managed data plane is using and breaks it. If it is regenerated by mistake, contact Tetrate to restore service. On a self-hosted data plane the same actions are an operator responsibility, described in Data plane credentials.
Step 3: review available models
The model catalog controls which AI models are visible and accessible to Developer Console users. Administrators can enable or disable models globally, and configure per-model settings such as context window limits. Spend is controlled with a budget and throughput with a rate limit, not with per-model settings. Developers select models by name, and the gateway routes to the appropriate provider automatically.
Enabling a model here is only the first of three things a developer needs. Its provider also needs a working credential, which is supplied by the customer on Enterprise rather than by Tetrate, and the model has to be granted to the project the developer calls through. See Provision models and providers for the credential and Create a project and grant models for the grant.
-
Go to Catalog → Models in the sidebar.
-
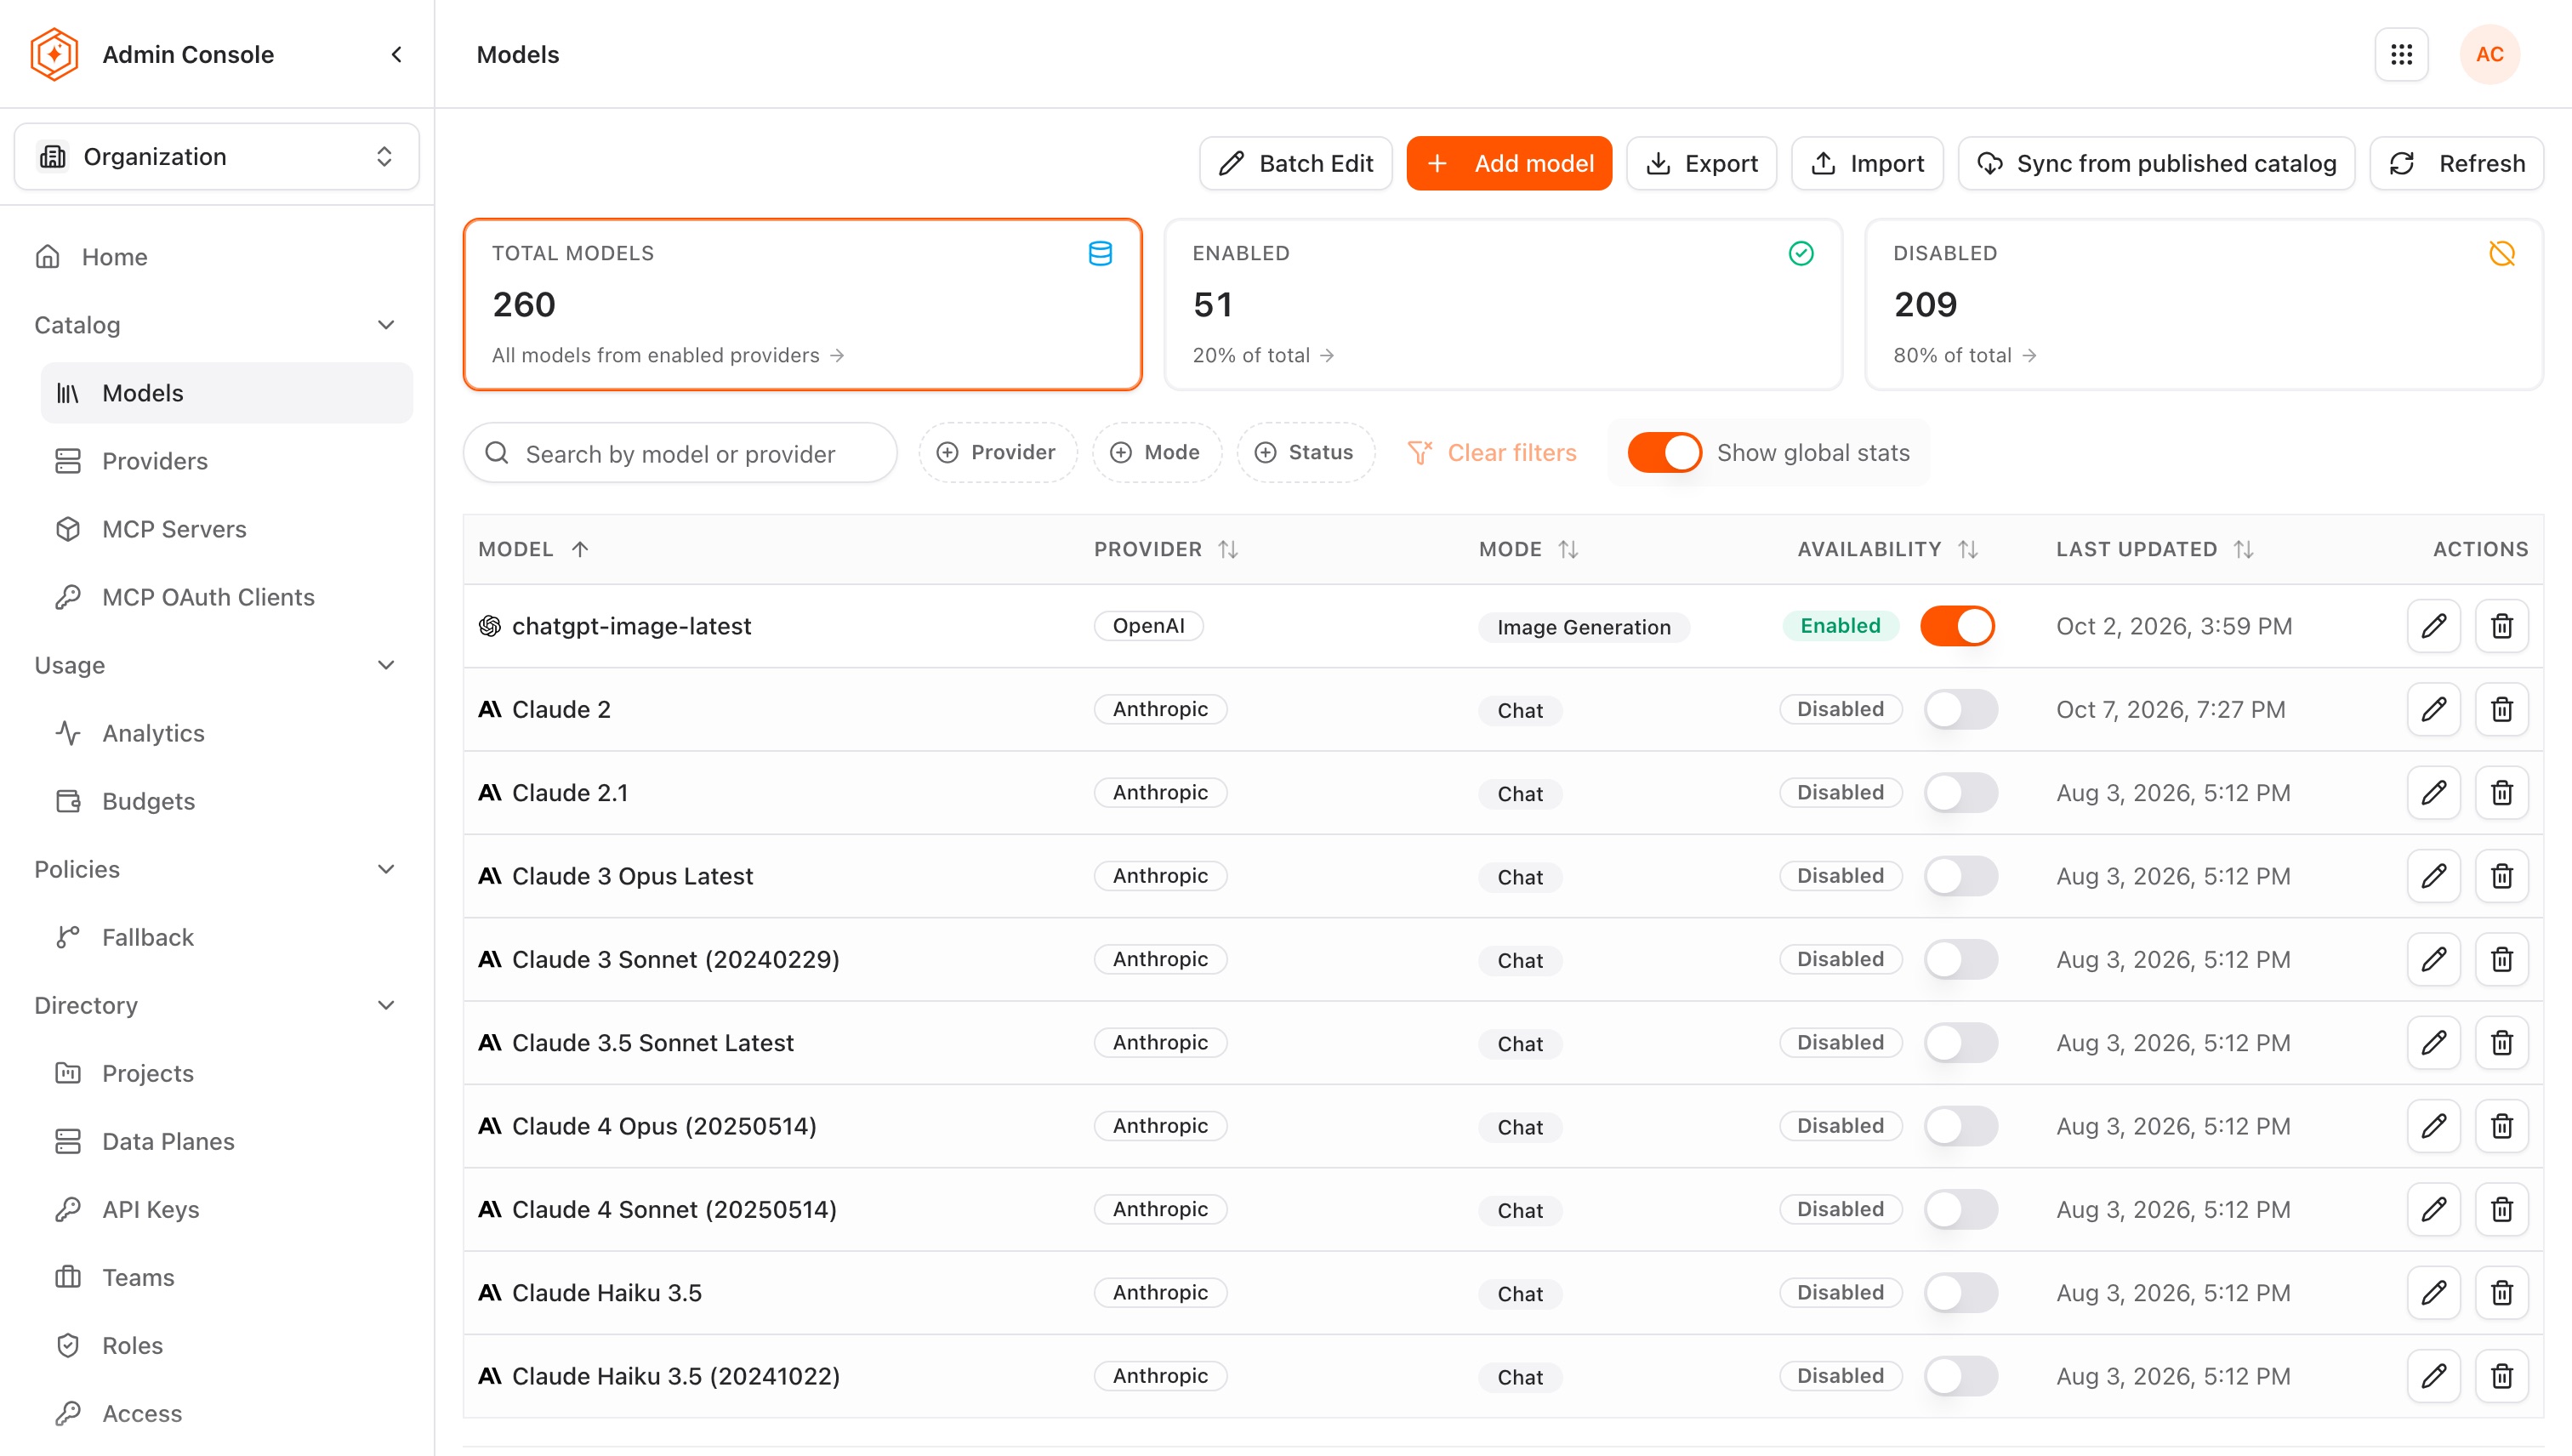
Browse the list of AI models in Agent Router. Each entry shows the model name, the provider it is sourced from, and its current availability status.
-
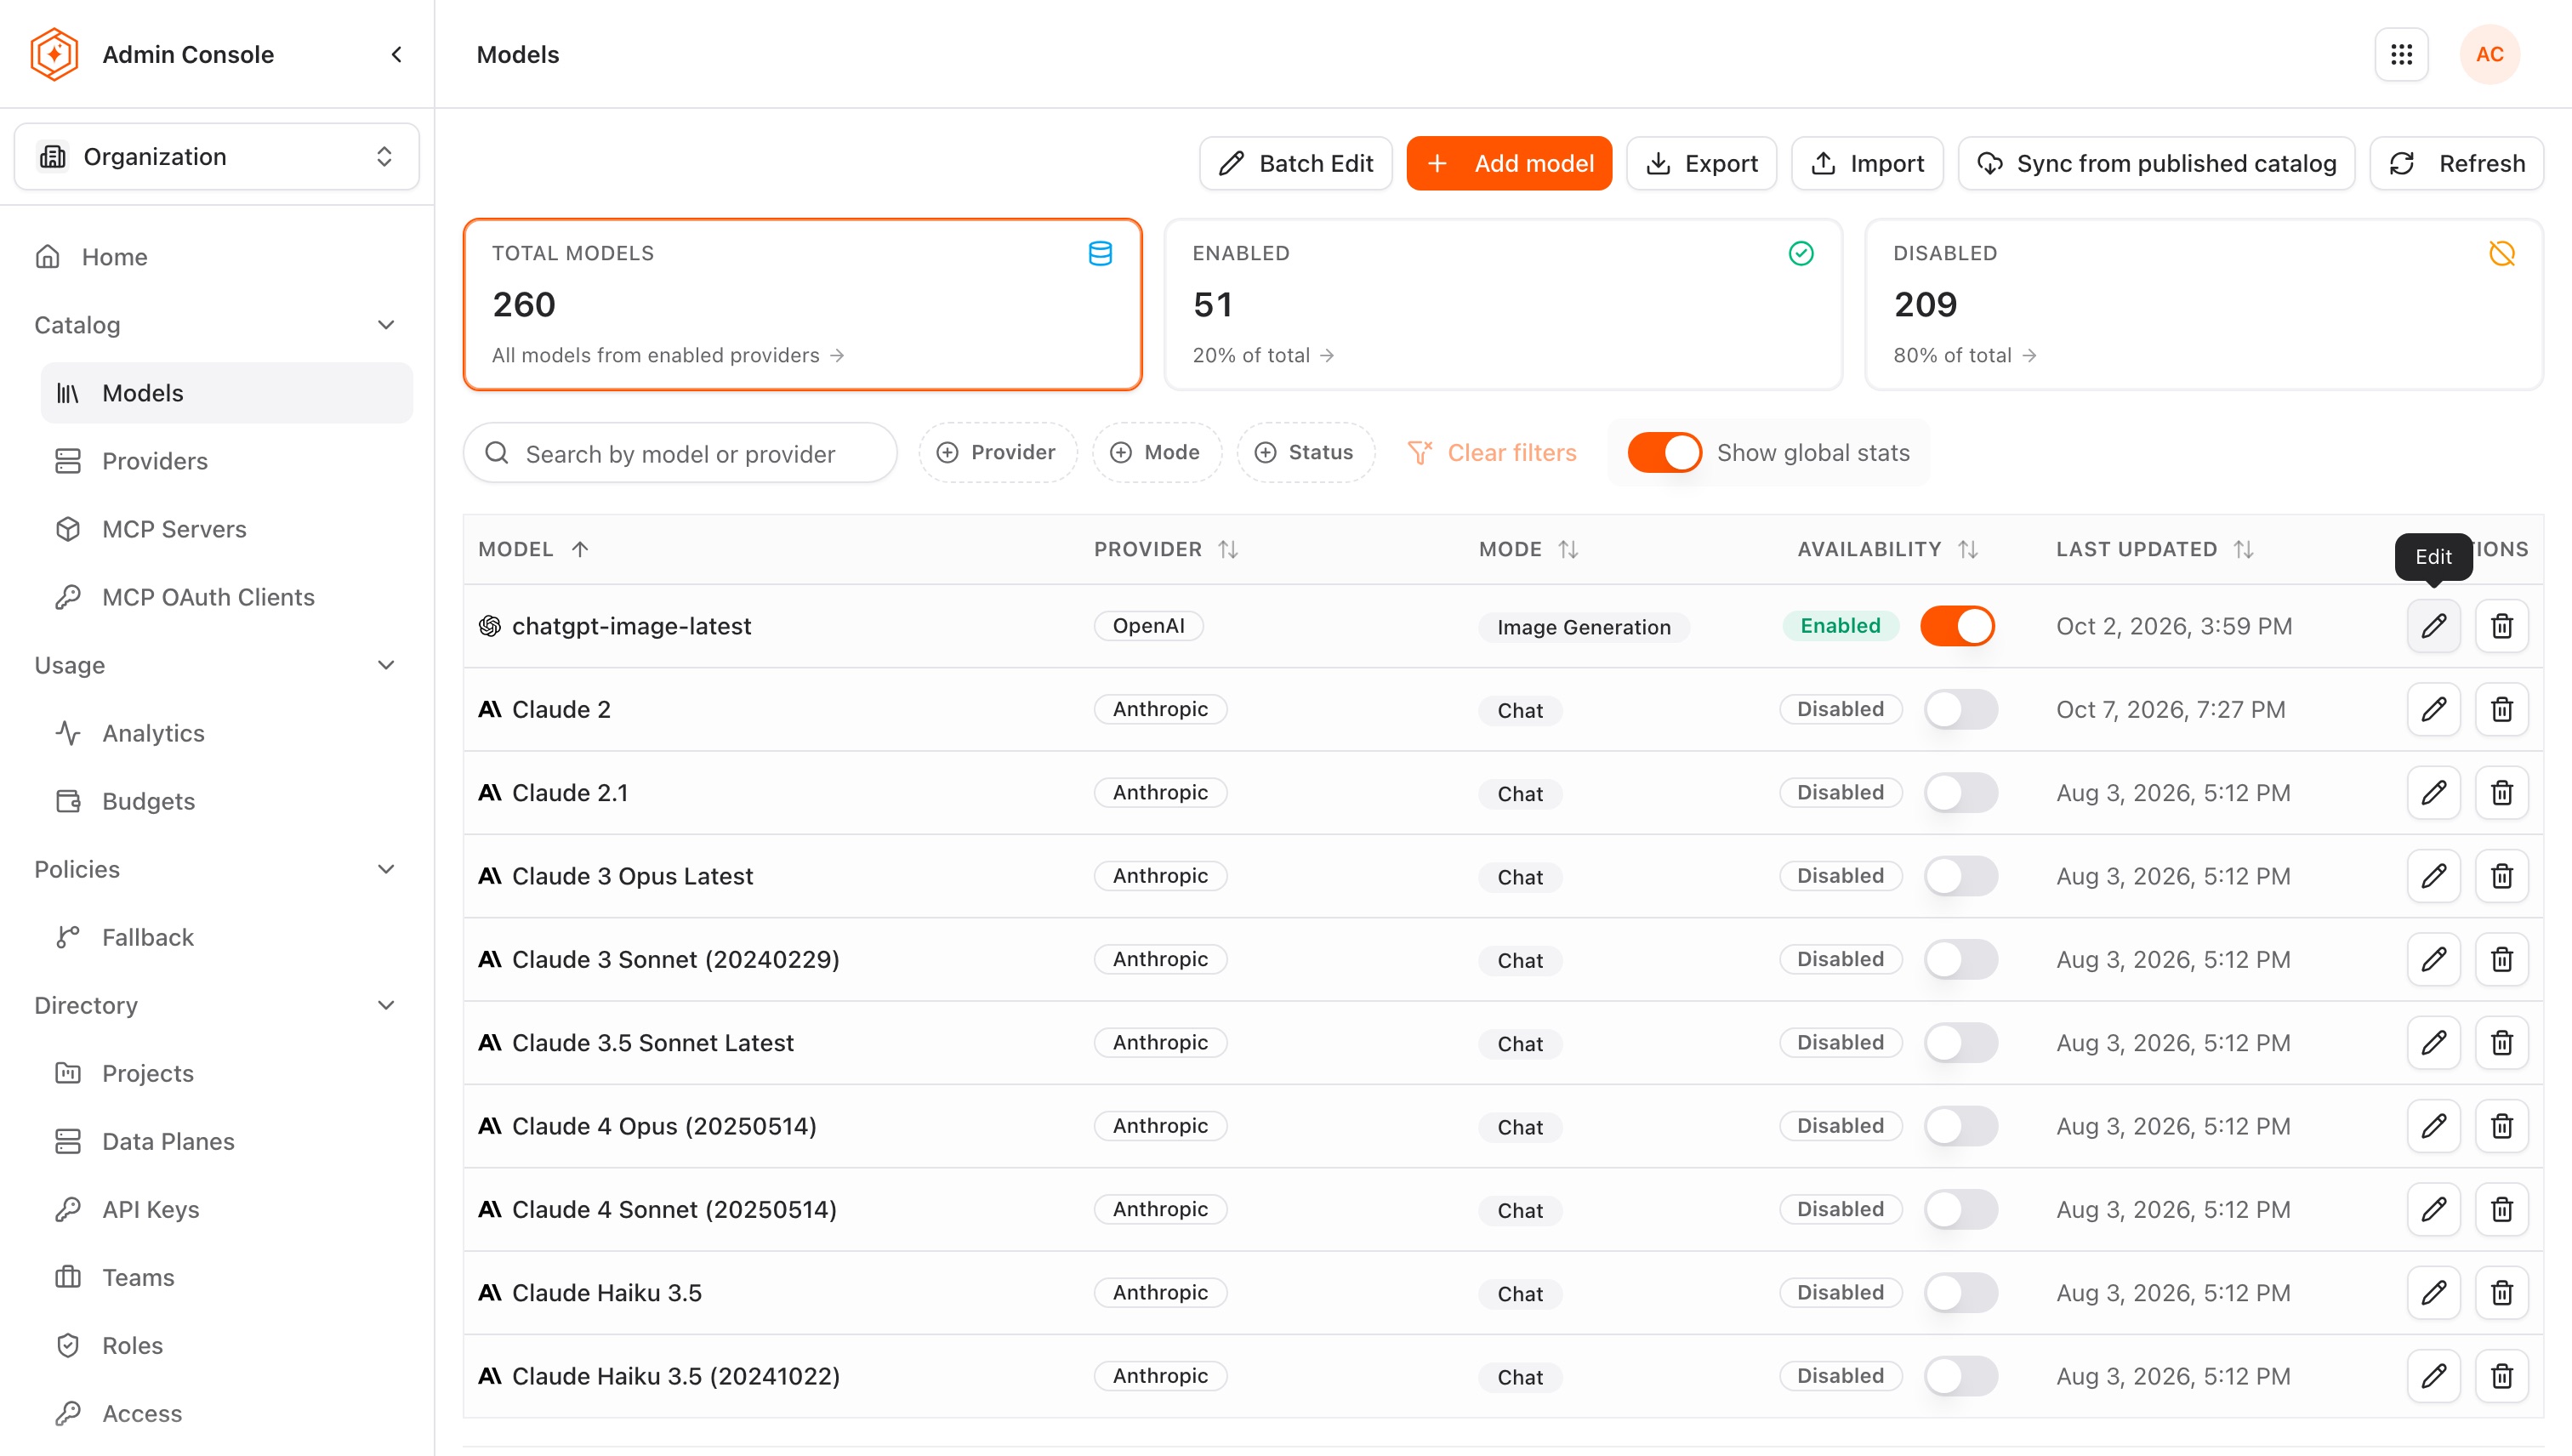
Use a row's availability toggle to enable or disable a model, and its edit icon to update its configuration. Disabling a model removes it from the Console model catalog immediately; requests that reference it by name receive a 404 error until the model is re-enabled or the developer updates their key policies.
Step 4: review providers
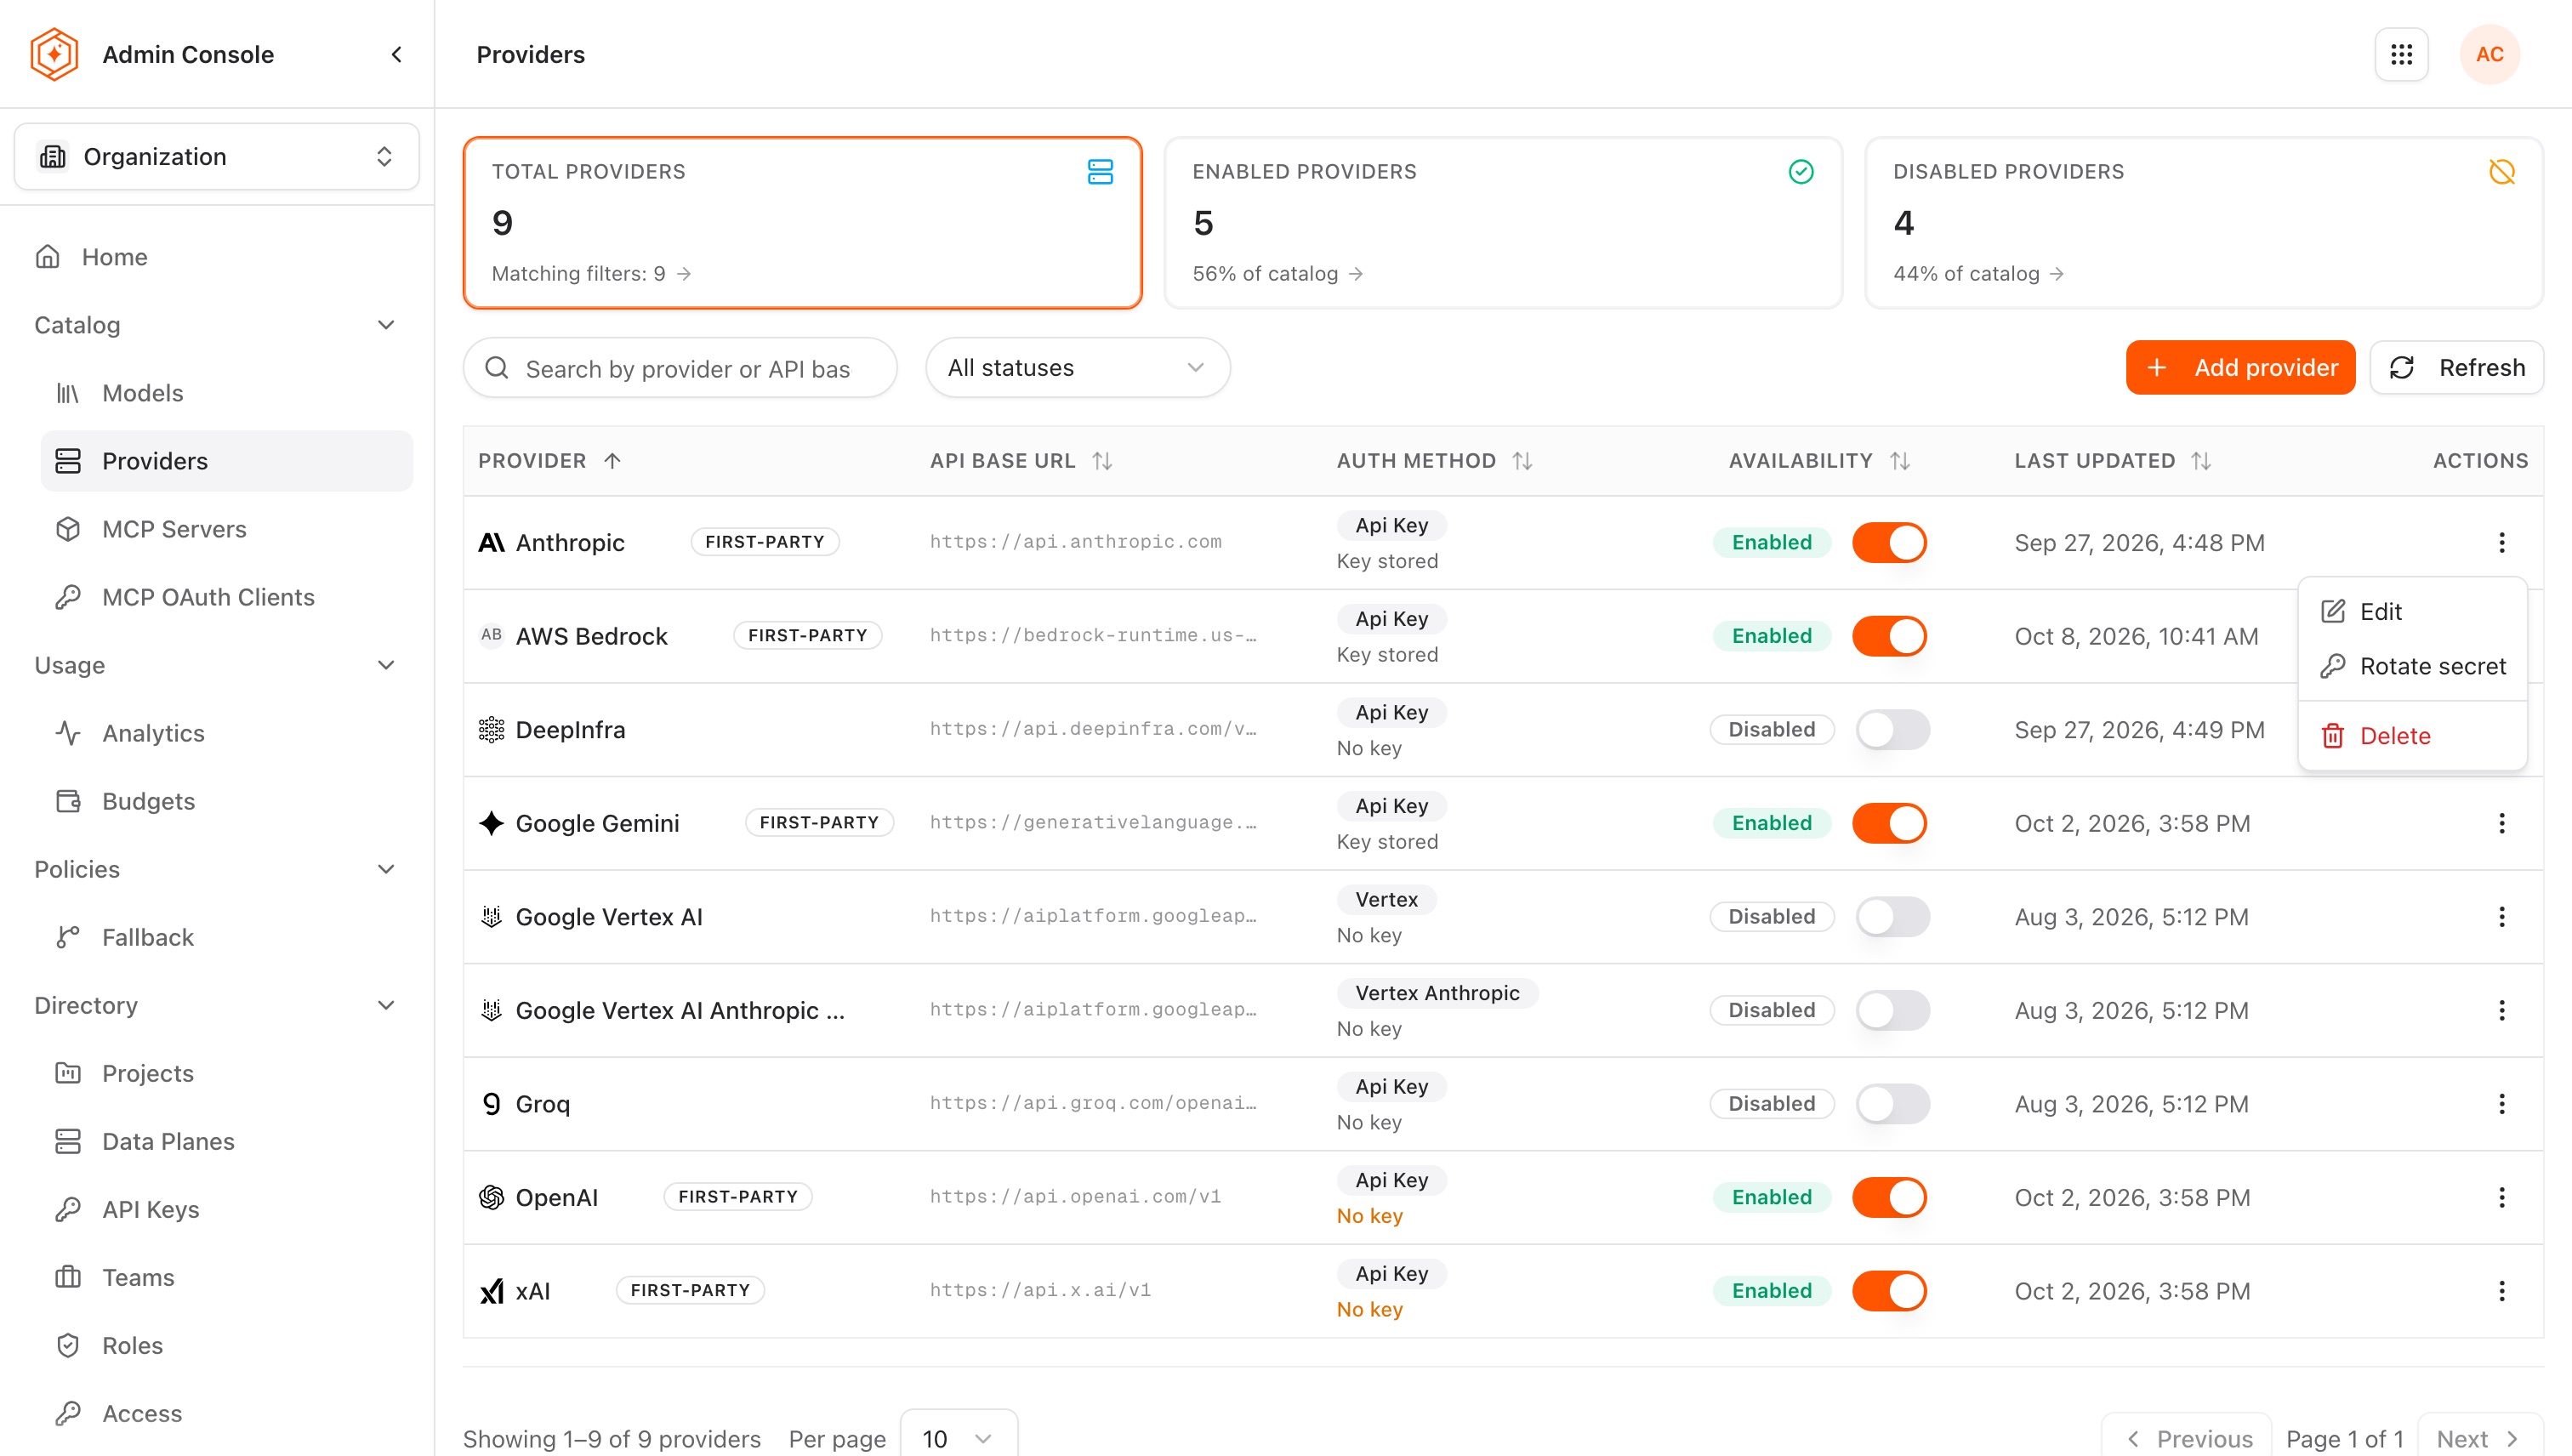
Providers are the upstream AI services that Agent Router routes requests to, for example, OpenAI, Anthropic, Azure OpenAI, or Google Vertex AI. Each provider entry in the Admin Console holds the credentials and endpoint configuration the gateway uses when forwarding requests. Developers never see or use these credentials directly.
-
Go to Catalog → Providers in the sidebar.
-
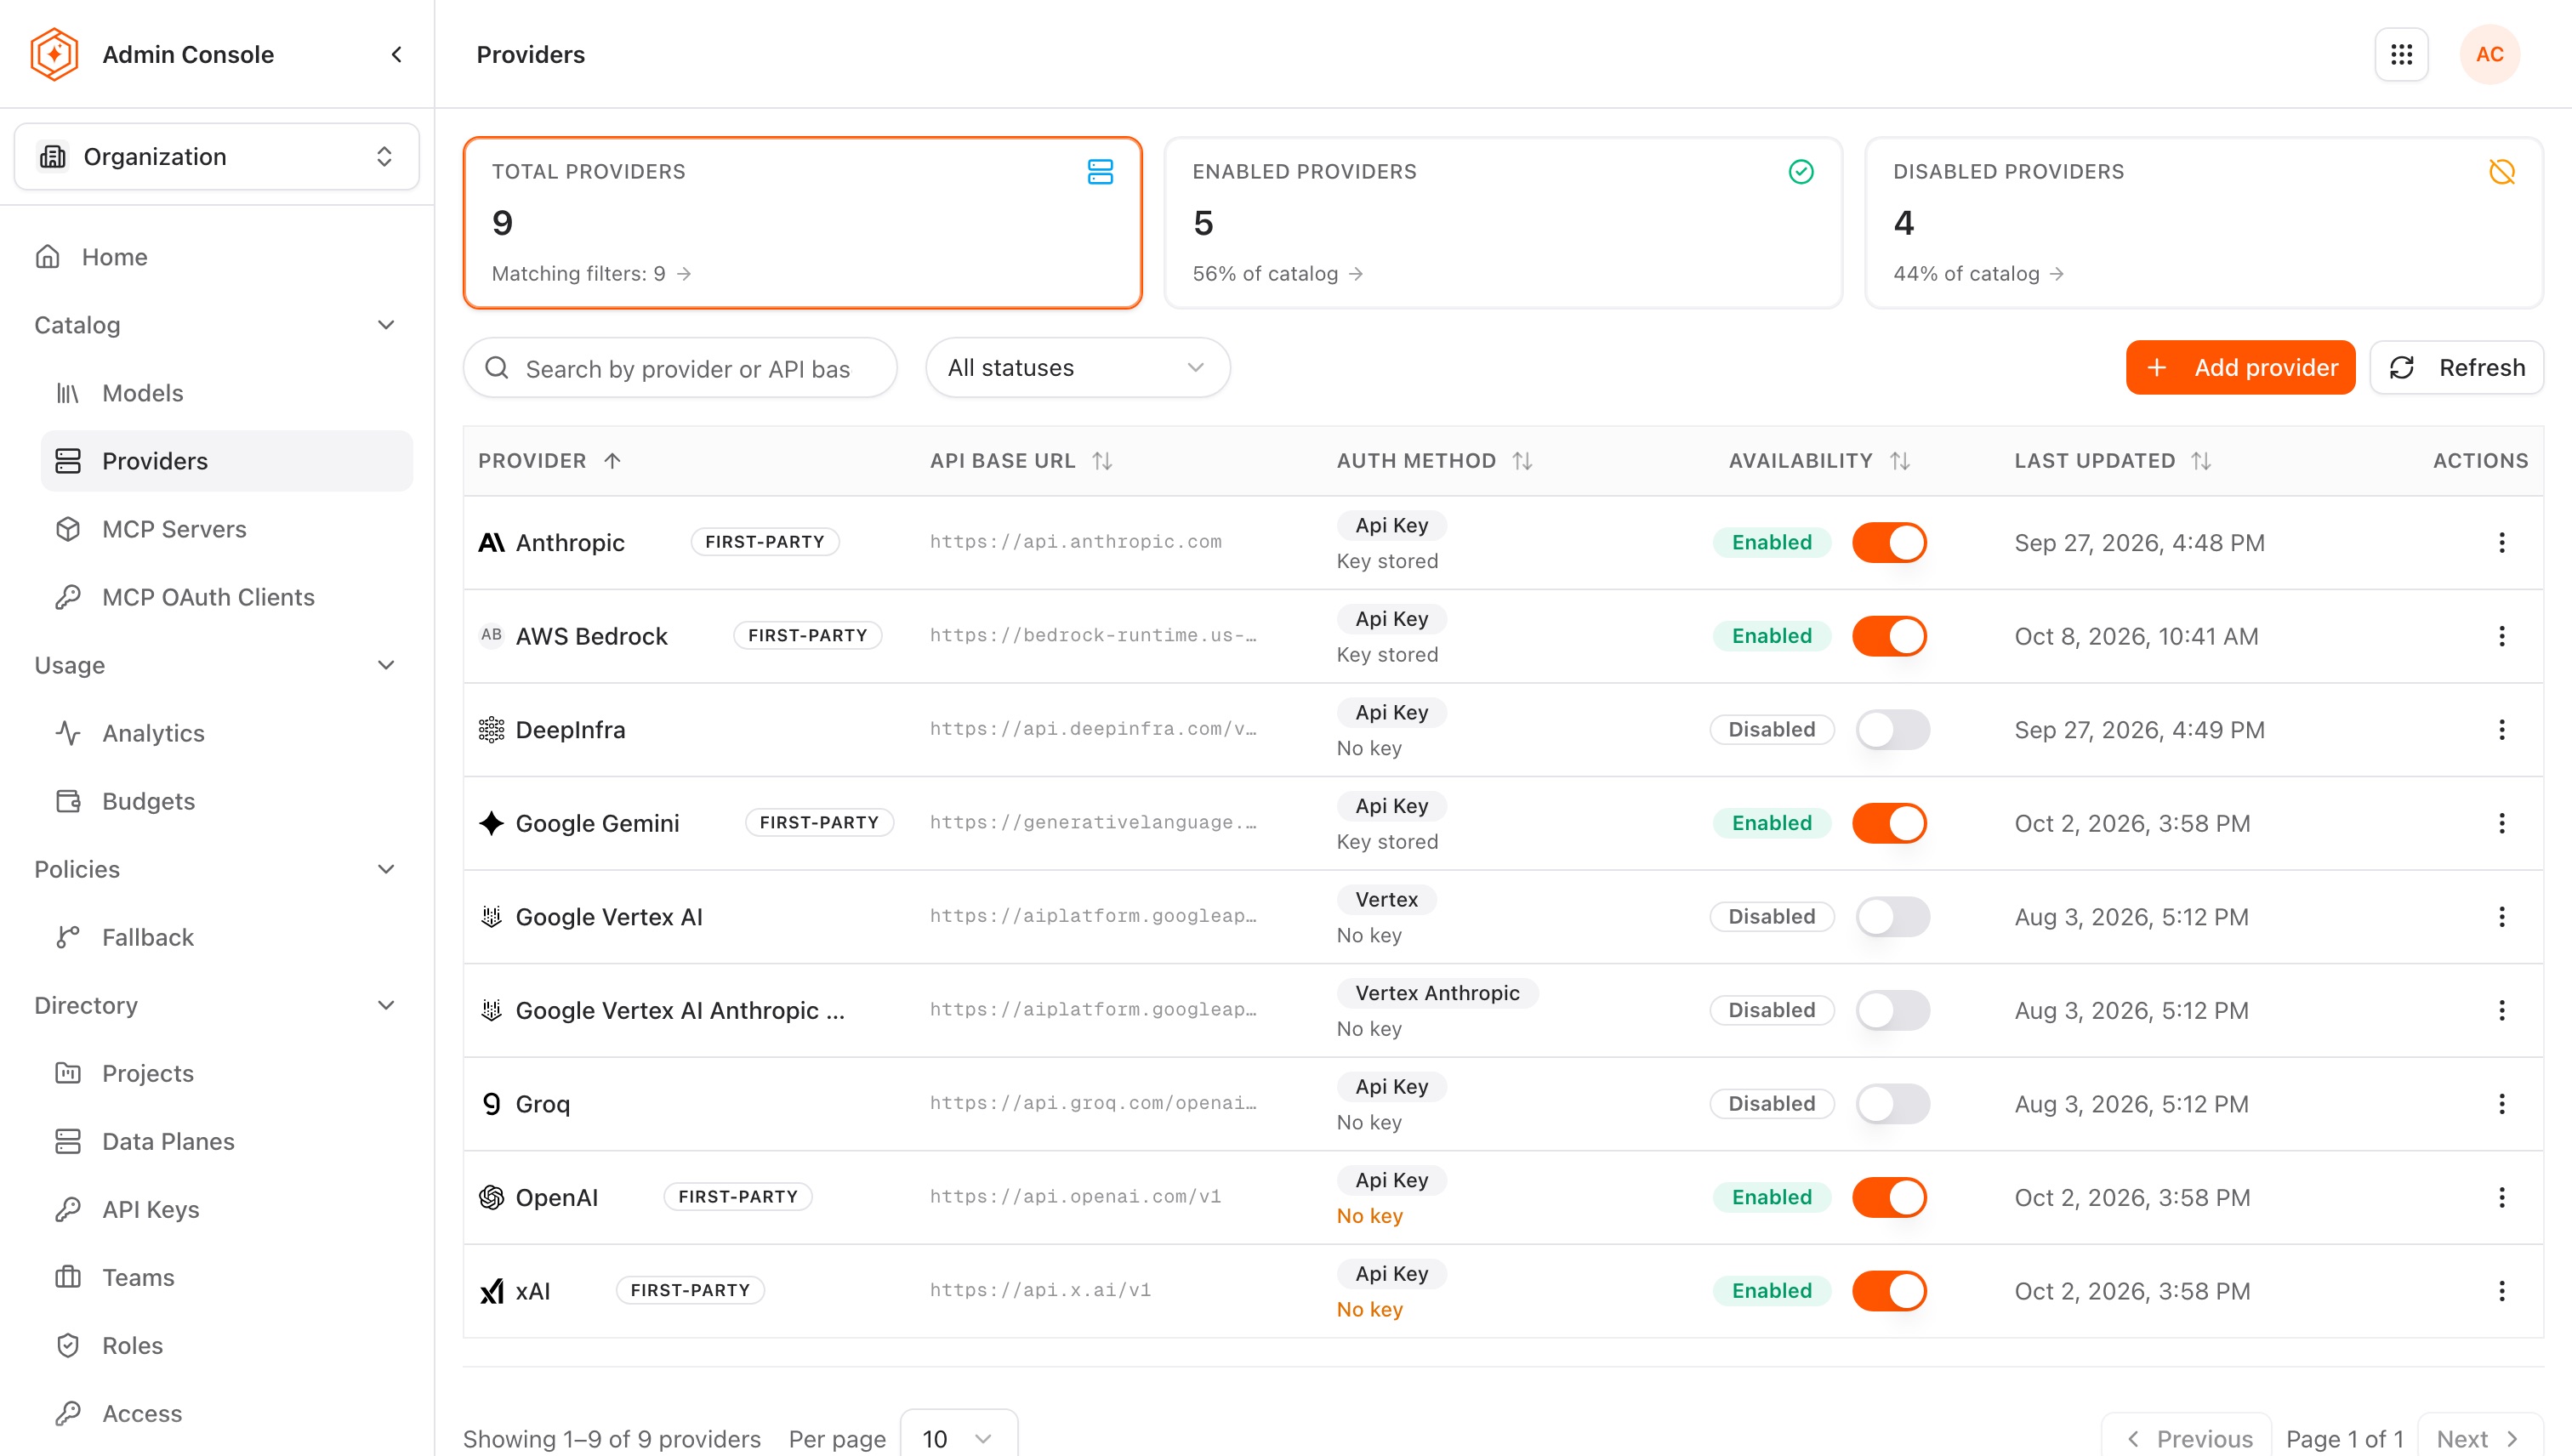
View the list of configured AI provider connections. Each entry shows the provider name, its API base URL, its auth method and whether a key is stored, and its availability.
-
Use the actions menu to Edit the provider (for example, to set a custom endpoint URL such as a private endpoint for Azure OpenAI via Azure Private Link), Rotate secret to replace its credential, or Delete it. A provider showing No key has no credential, and the gateway cannot route to it.
Step 5: view users
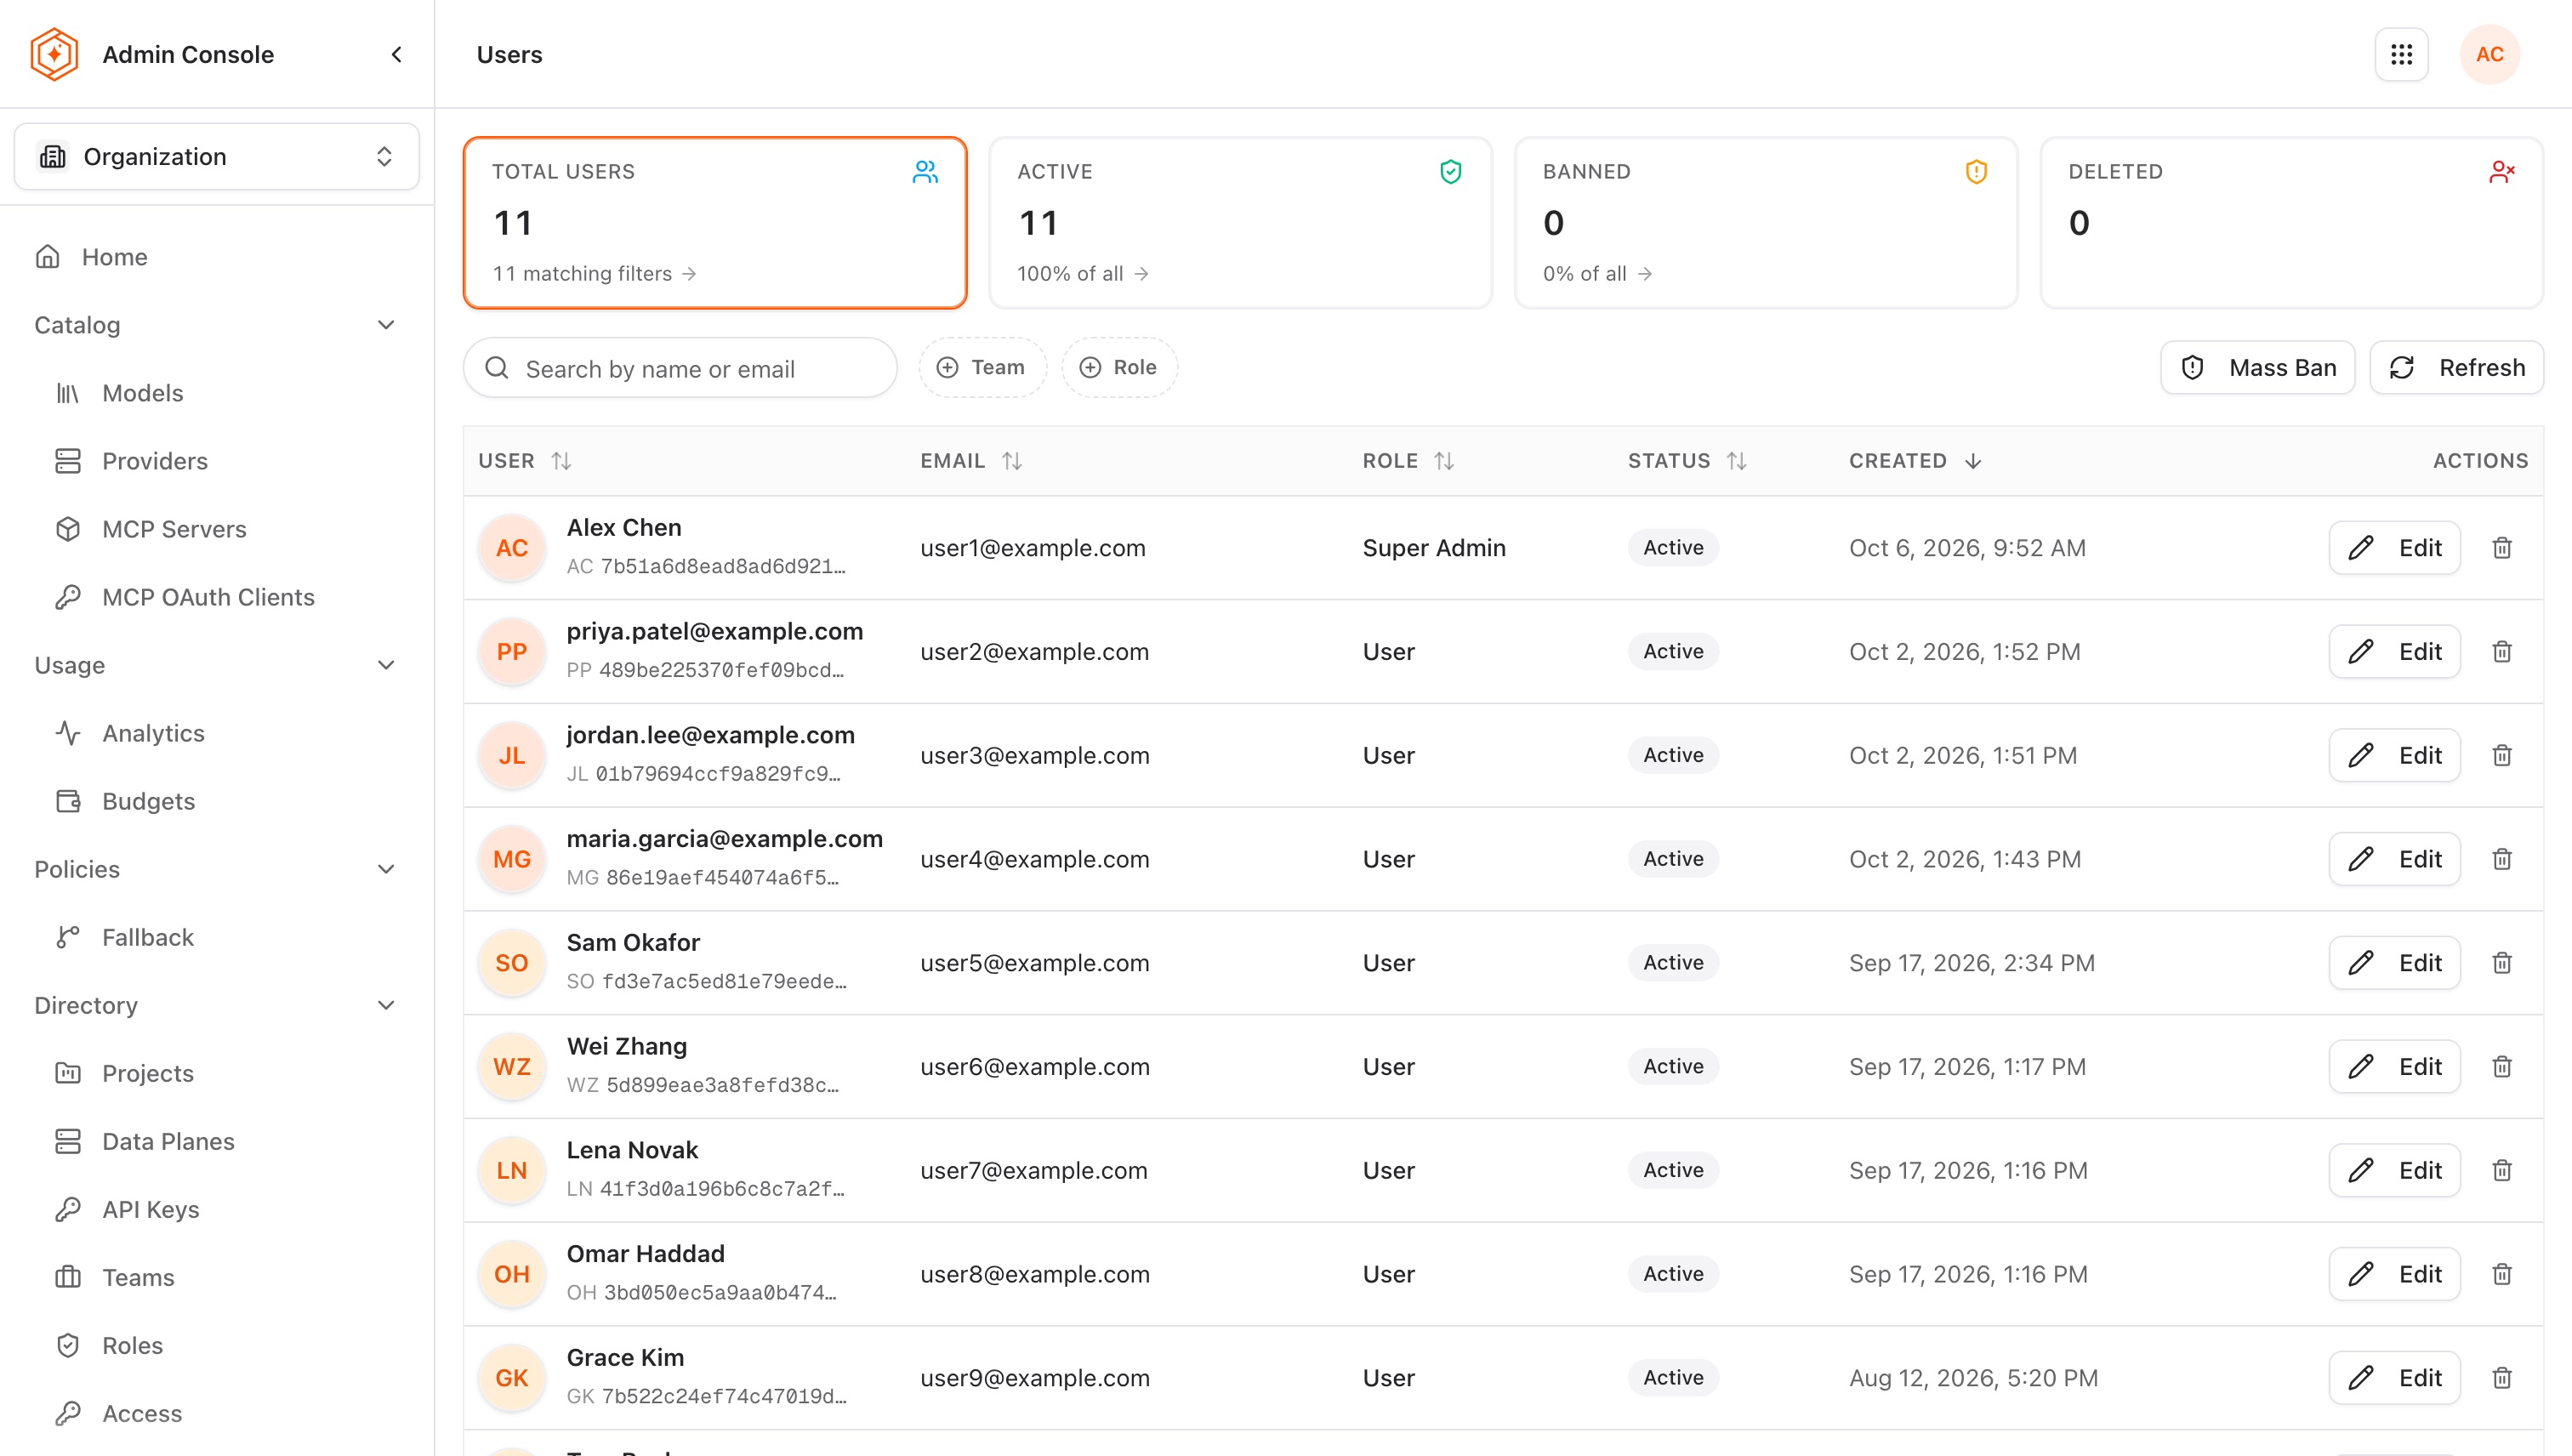
User management controls who can access Agent Router and with what level of permission. Each user is assigned one or more roles that determine what they can see and change in the Admin Console. Access to the Developer Console is not governed by these roles; it follows project membership.
-
Go to Directory → Users in the sidebar.
-
Review the list of registered users with their email, role, status, and creation date. The cards above the list count active, banned, and deleted accounts. This view is useful for confirming role assignments after onboarding and auditing who has elevated access.
-
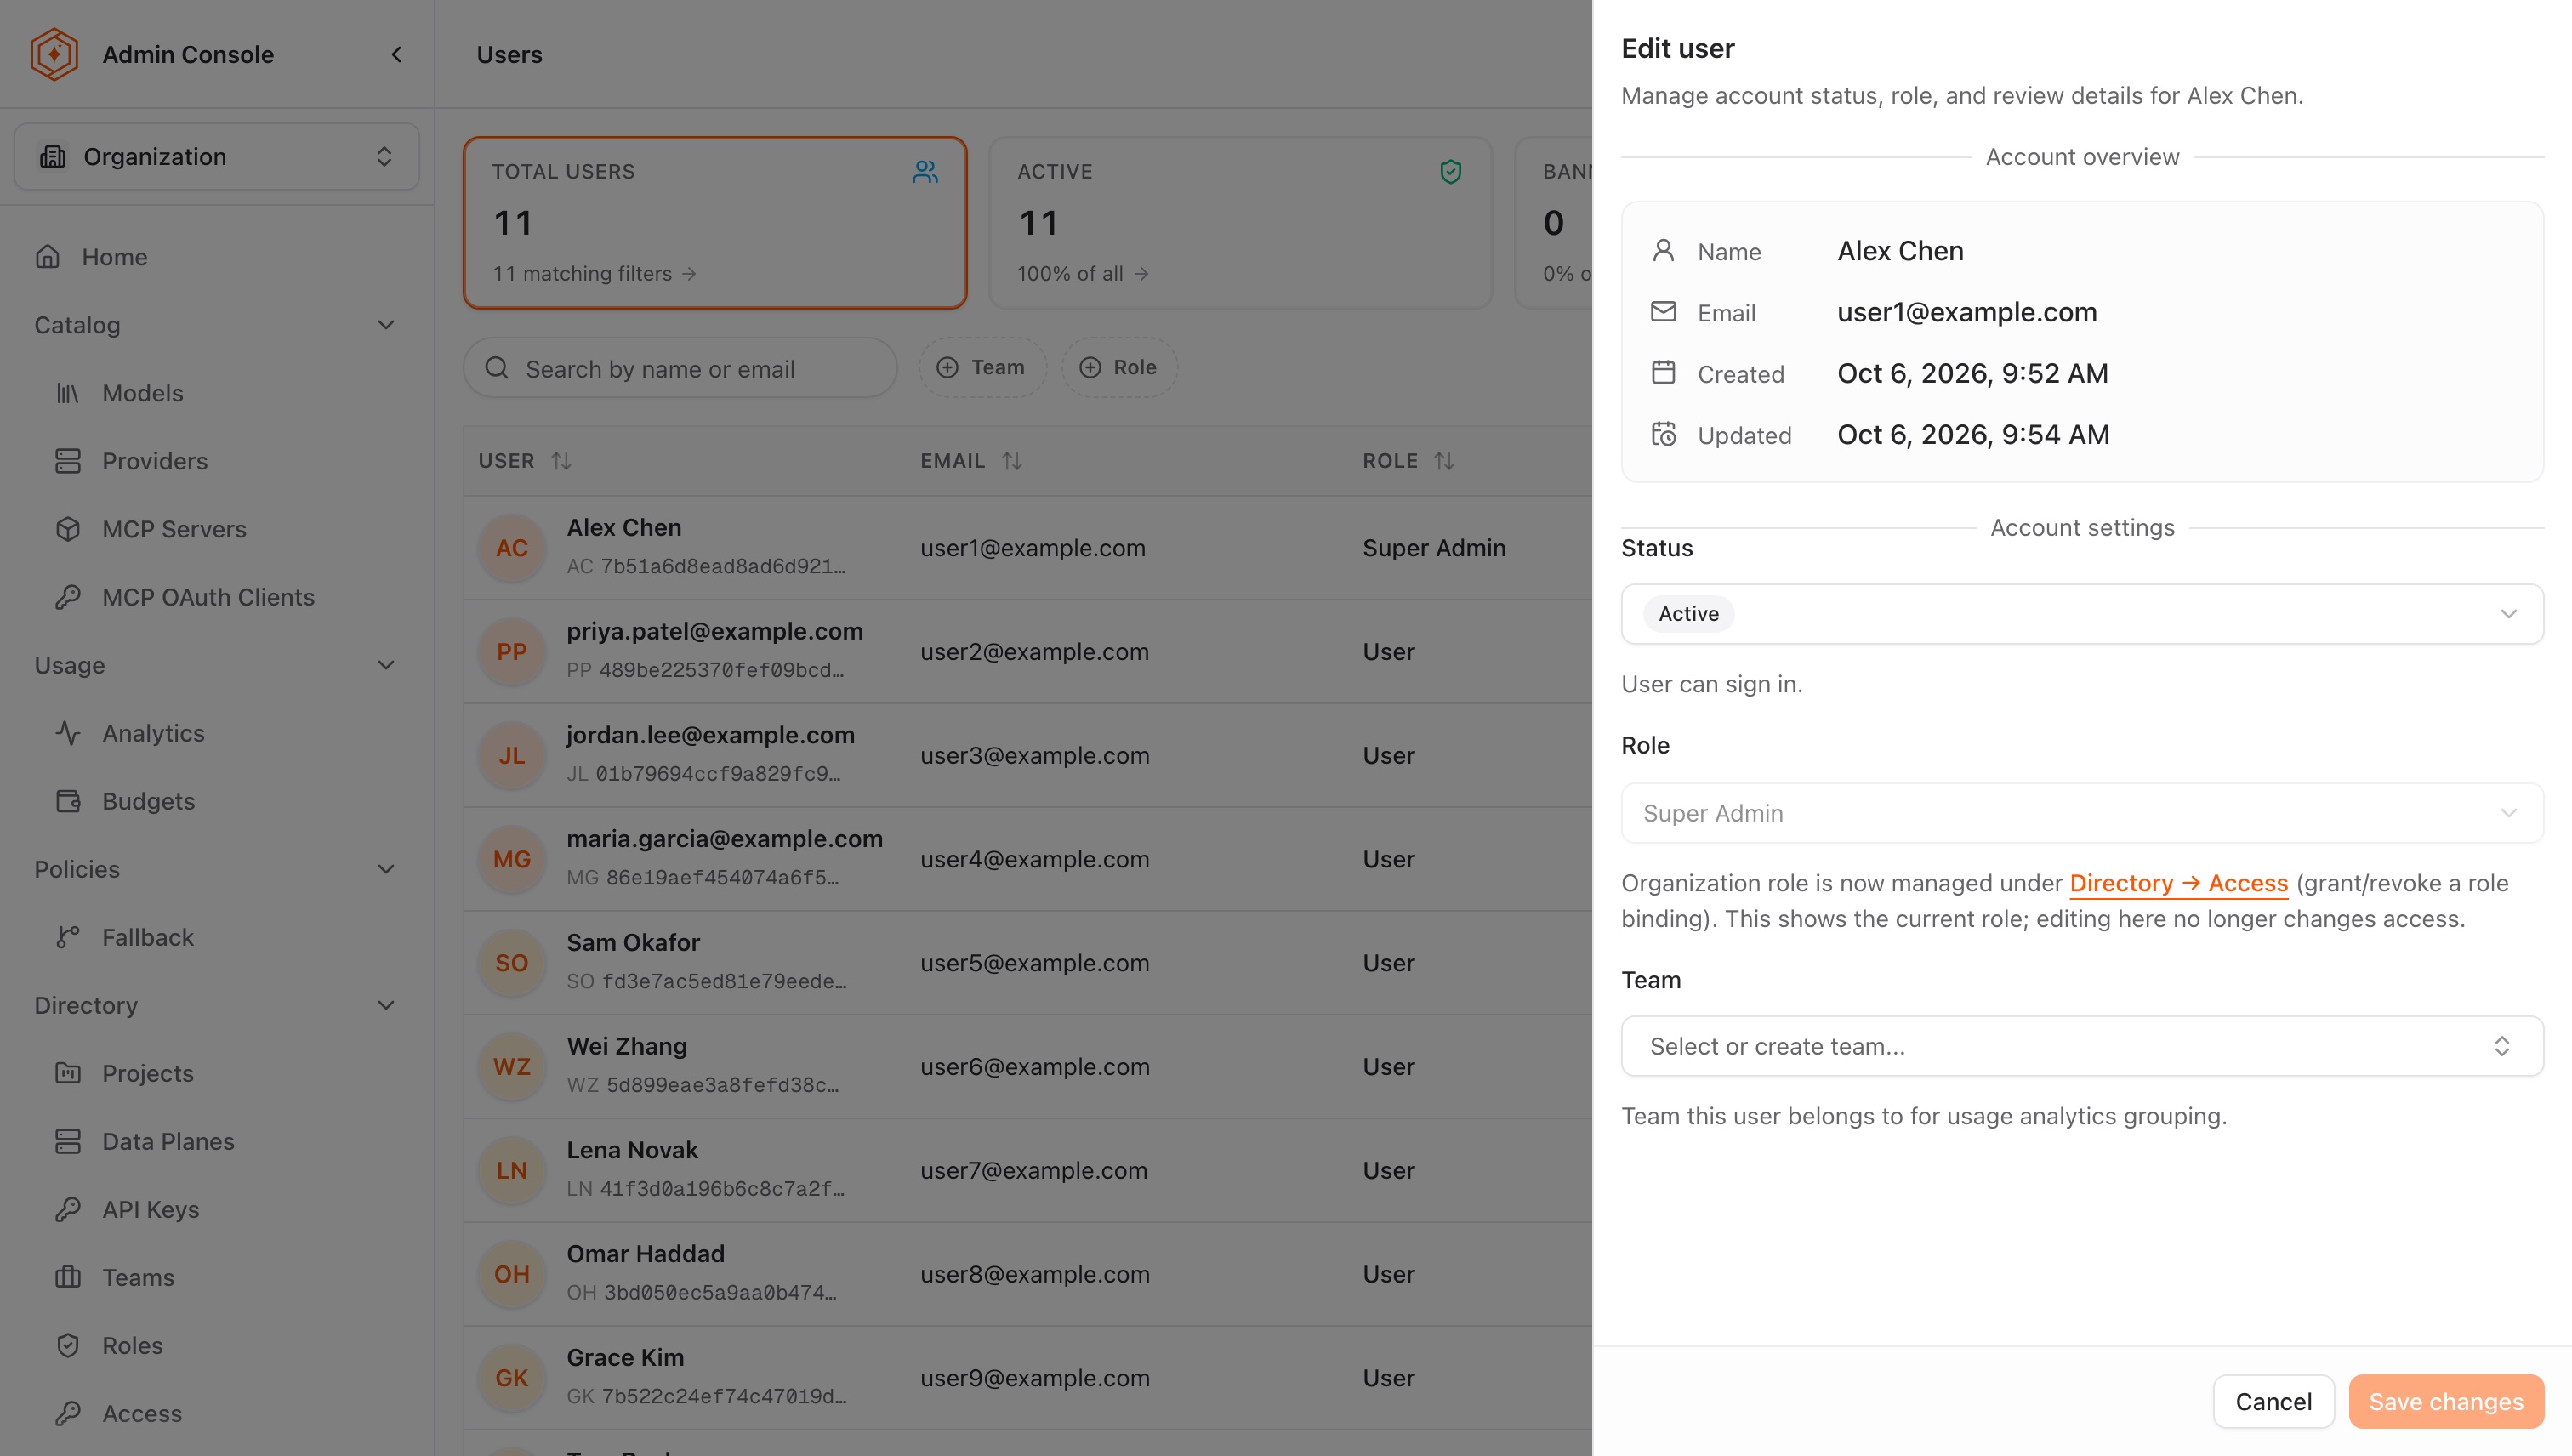
Click Edit to change an account's status (for example, to ban it) or its team. Organization roles are granted and revoked under Directory → Access, and the row's delete icon removes the account; see Ban, delete, and restore user accounts. Credentials are managed in the identity provider, not in Agent Router.
Step 6: check usage analytics
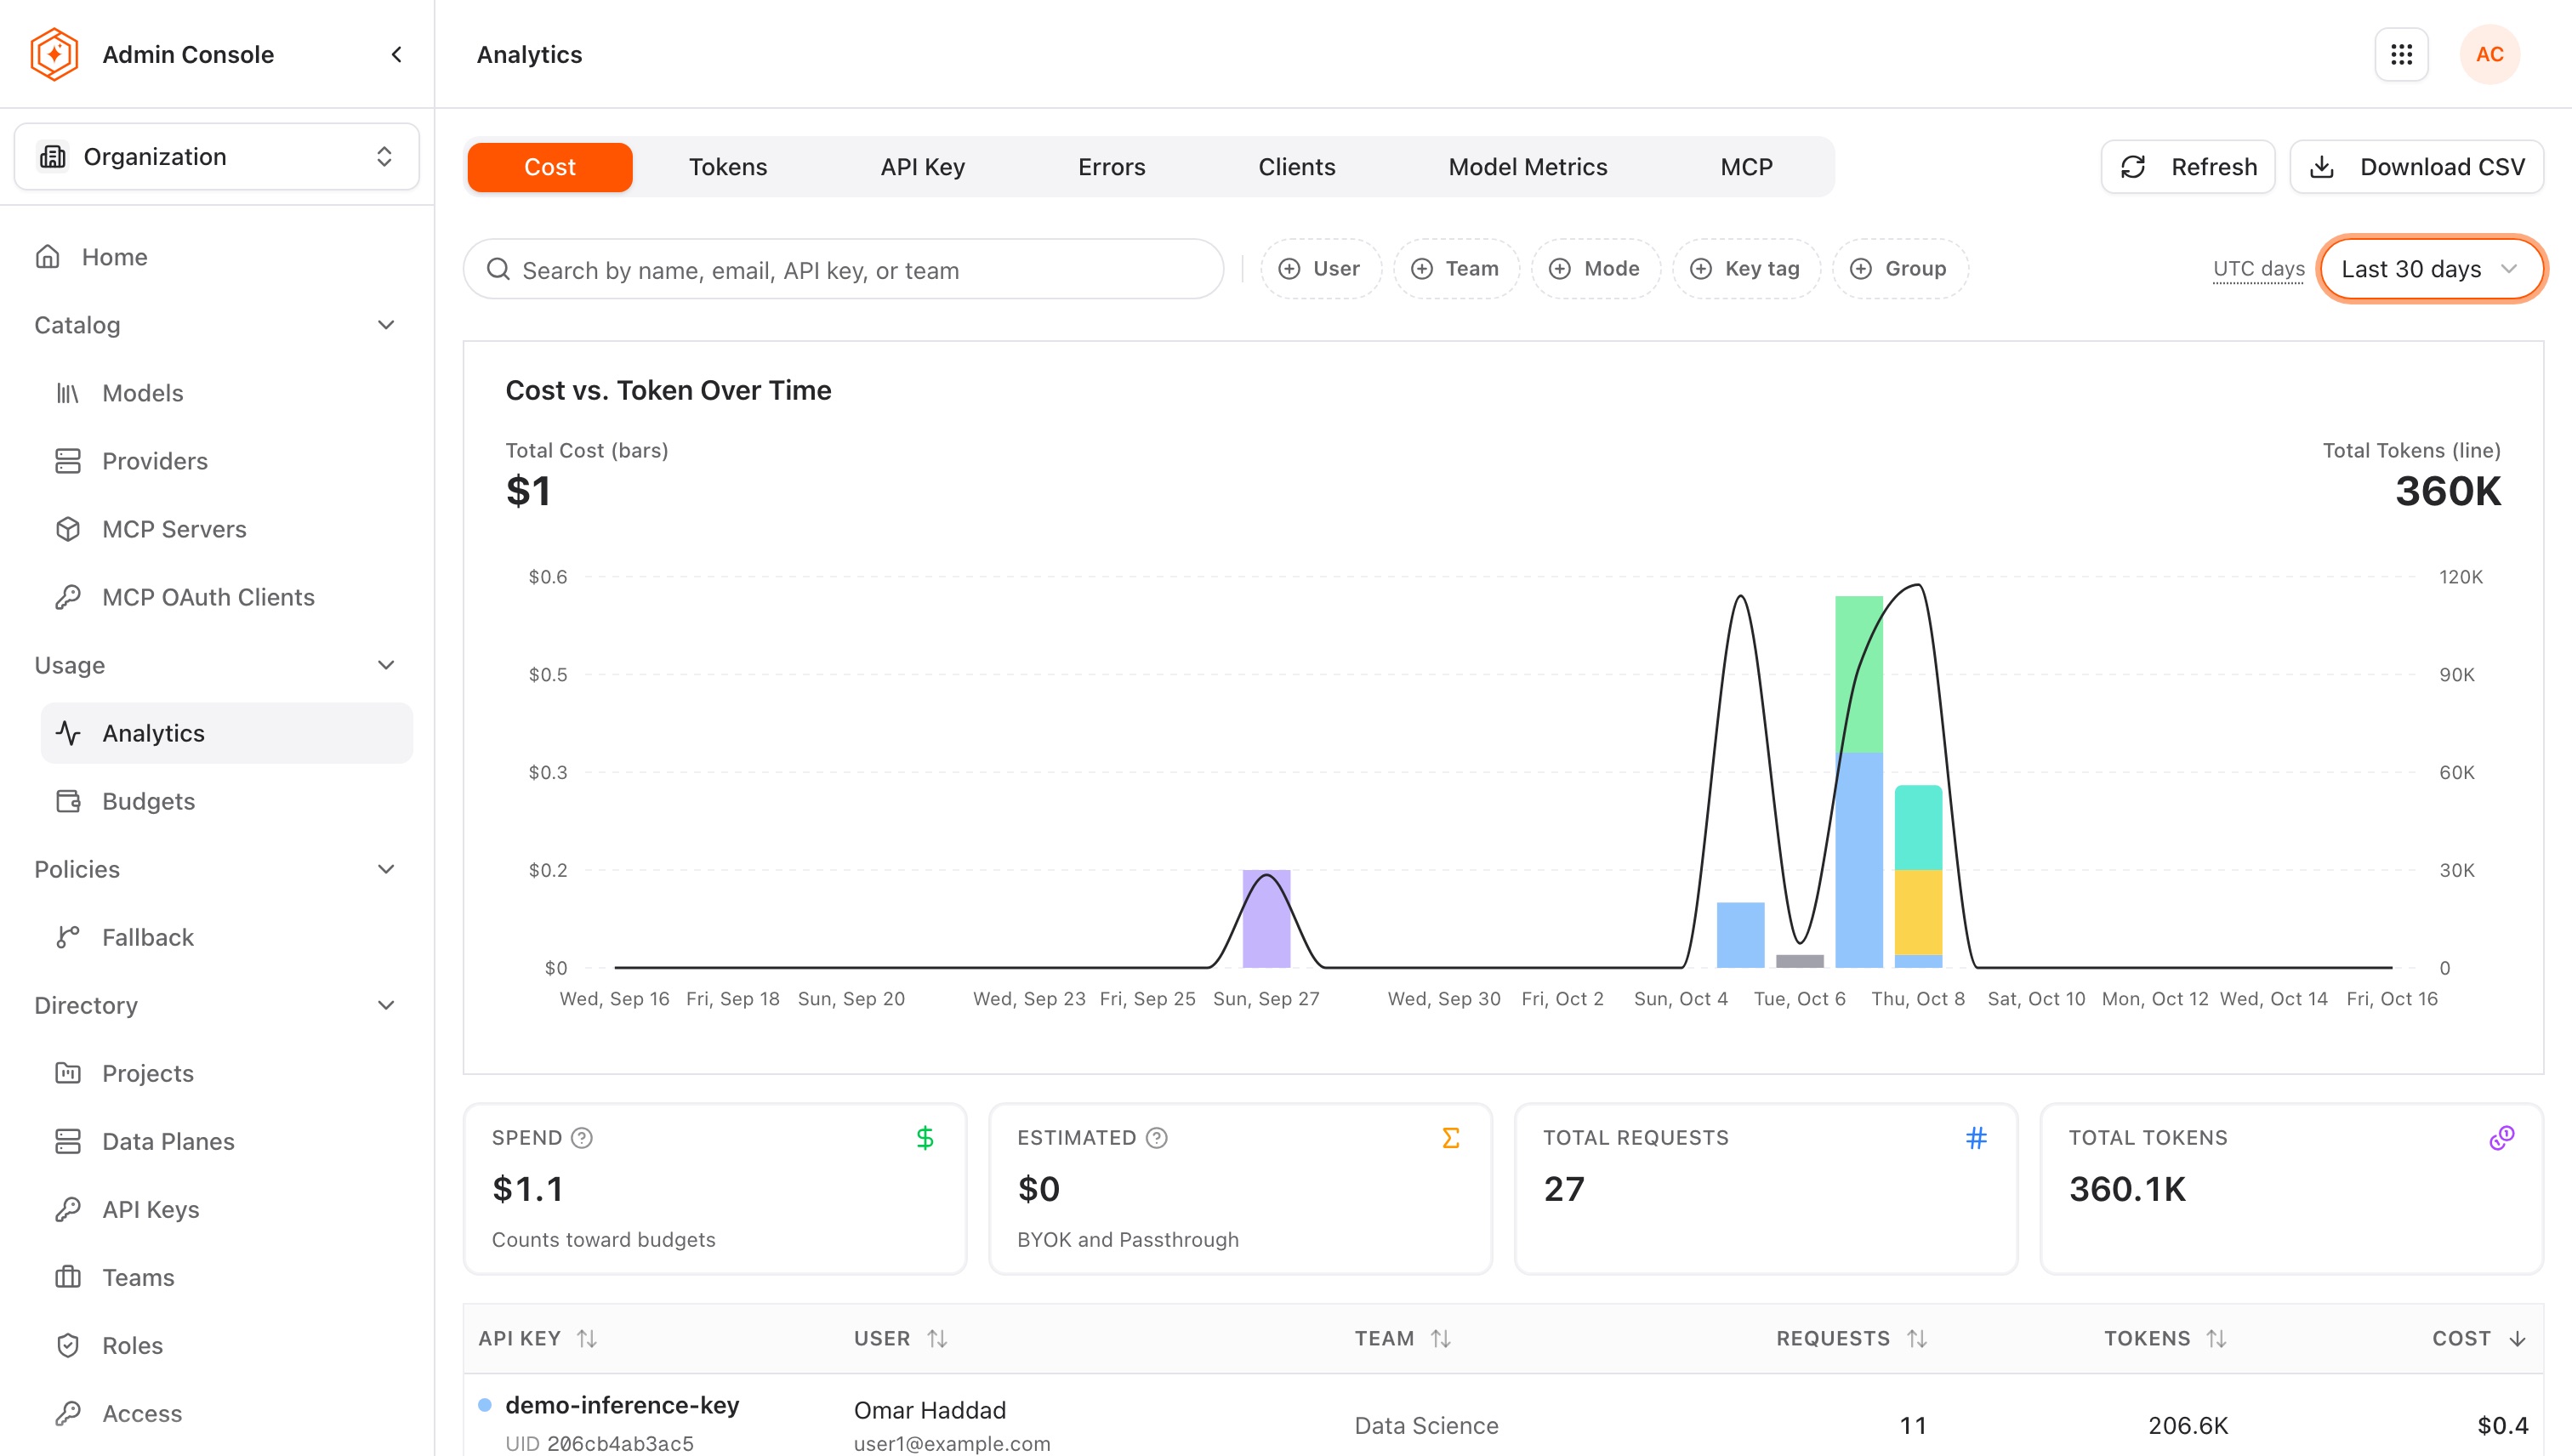
Usage → Analytics provides an organization-wide view of AI consumption across all users and API keys, as input to decisions about model availability.
-
Go to Usage → Analytics in the sidebar.
-
View aggregate usage across Agent Router. The default view shows total requests, token consumption, and cost estimates.
-
Drill down to identify the top consumers by API key or user, the most frequently requested models, and cost trends over configurable time periods. To compare several people or teams on the same chart, see Compare user and team spend in Analytics.
Step 7: view model metrics
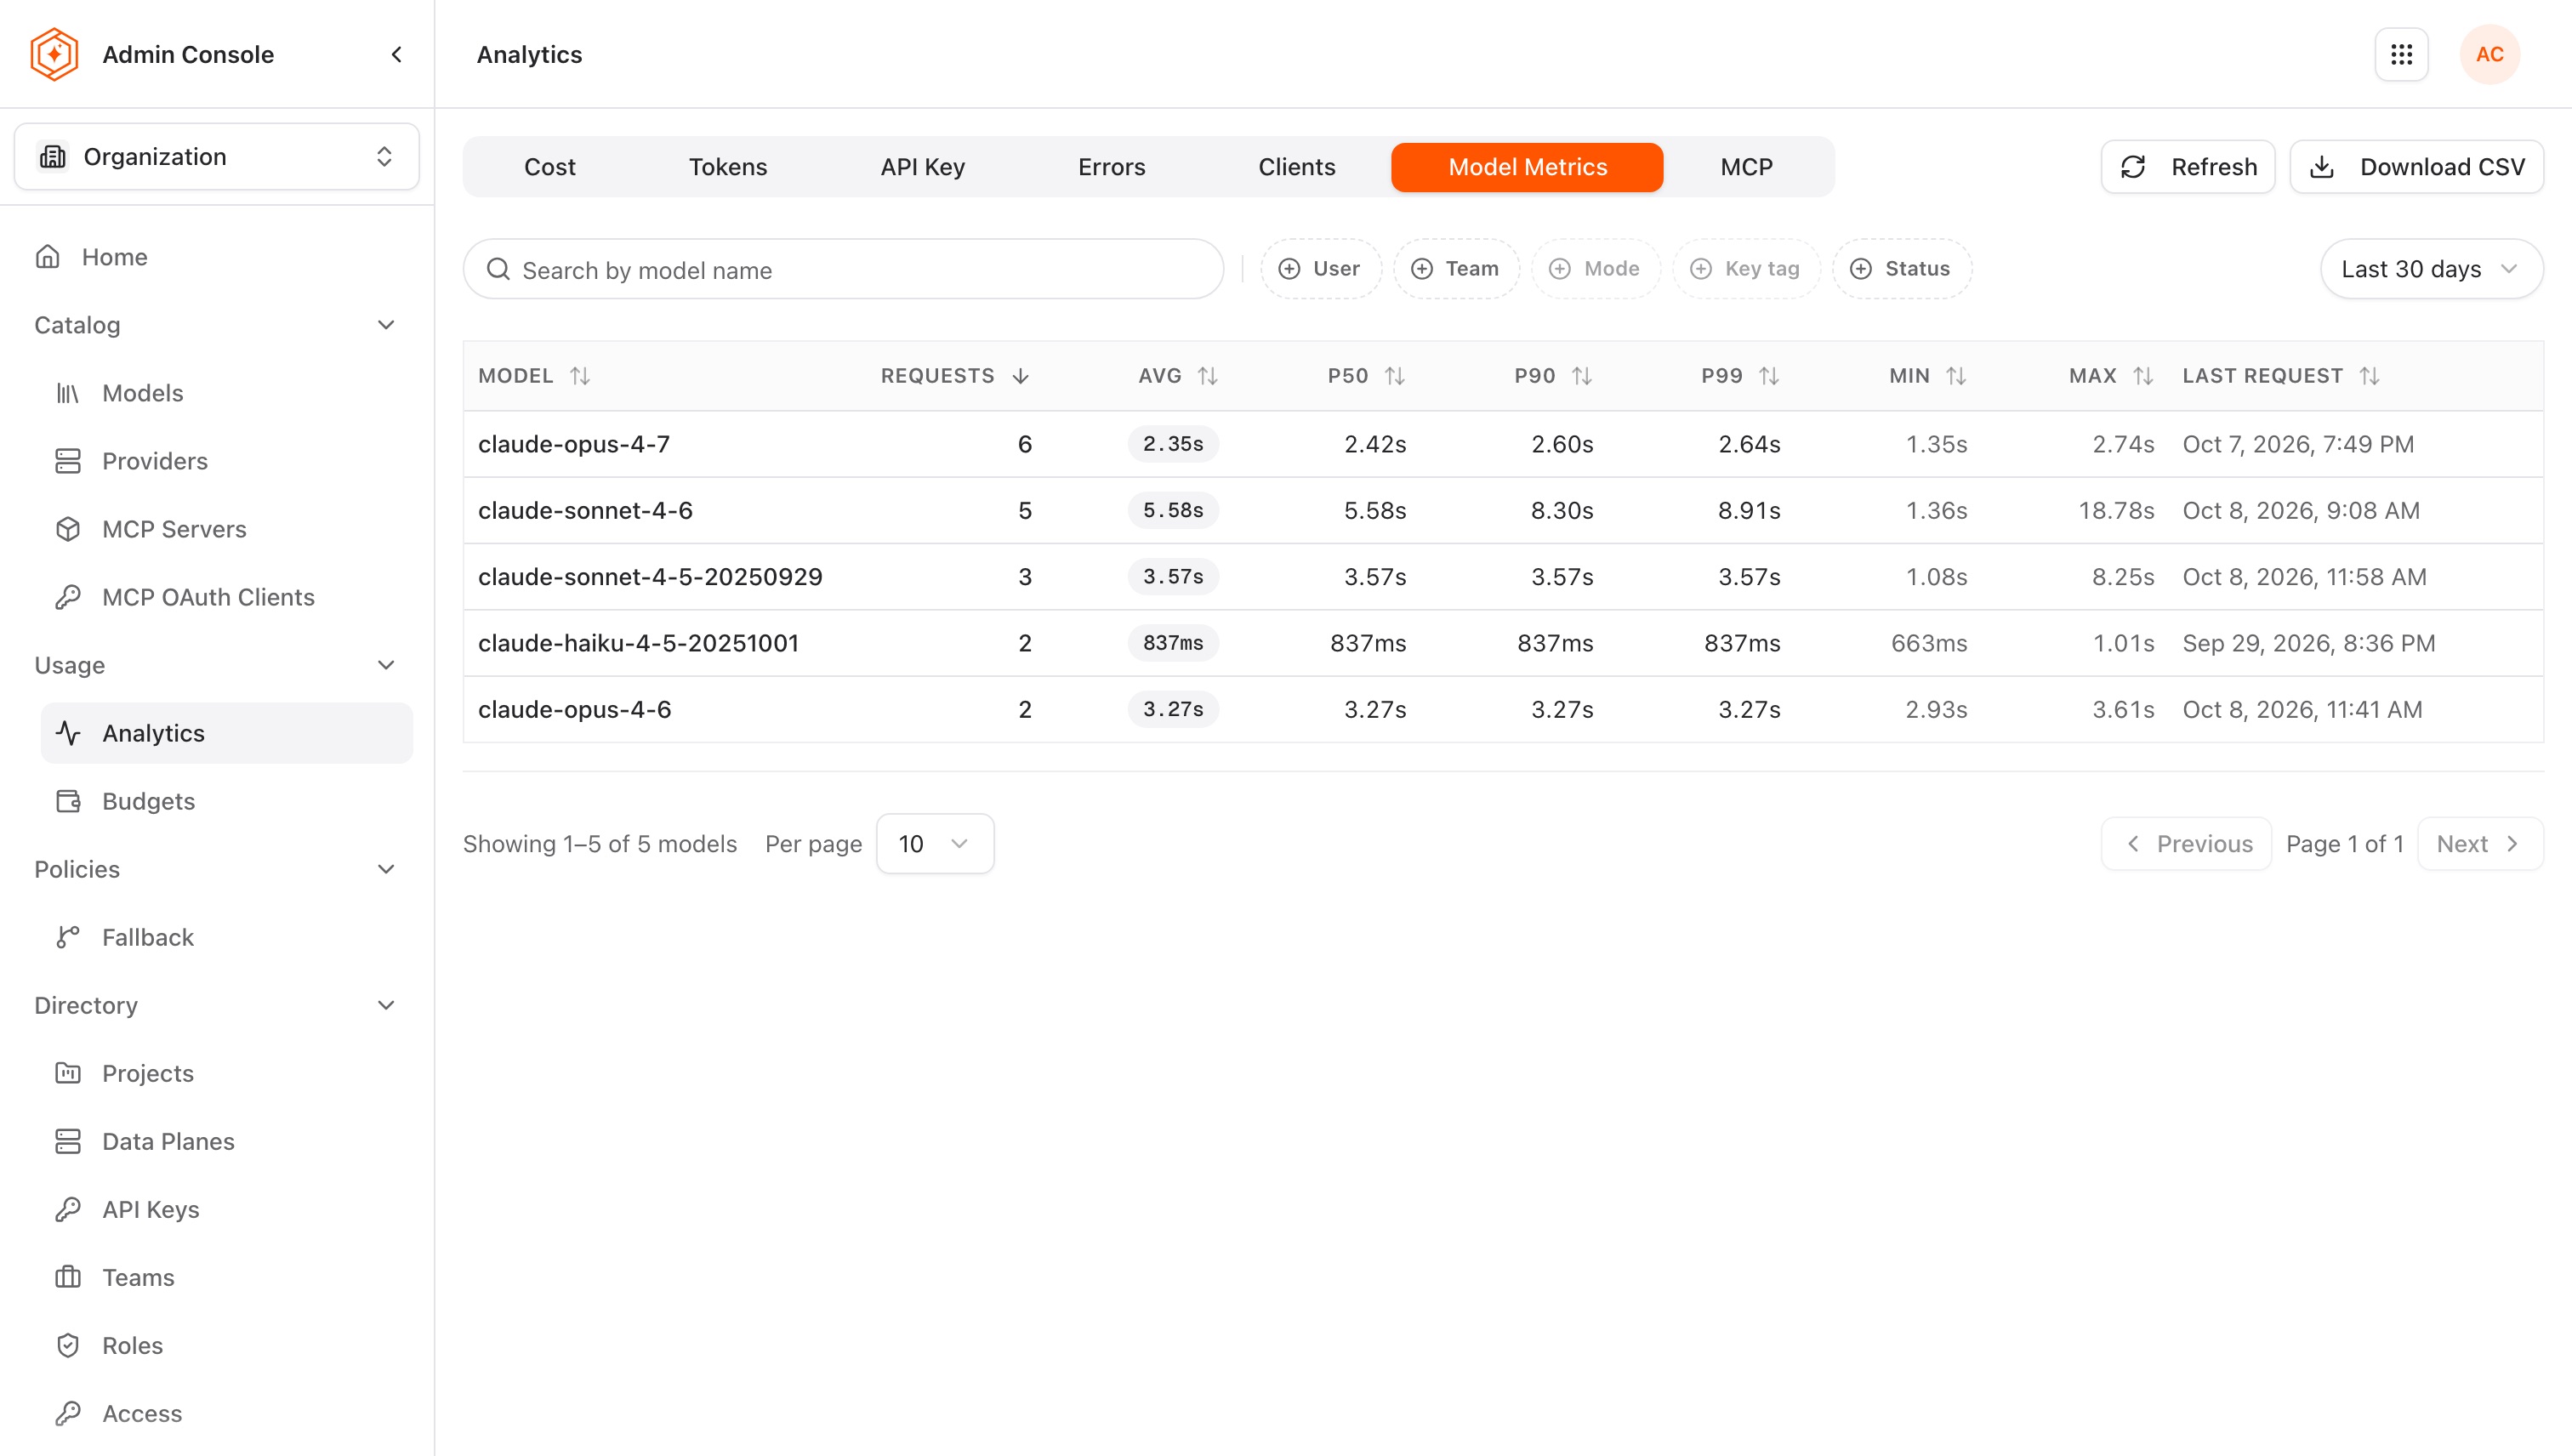
Model Metrics provides performance telemetry broken down by individual model. Use it to evaluate model reliability and latency before expanding availability, and to detect provider degradation early.
-
In Usage → Analytics, open the Model Metrics tab.
-
Review per-model performance data, including:
- Requests: how many requests each model served in the time range, a measure of relative demand across the model catalog
- Latency: the average, p50, p90, p99, minimum, and maximum response times, which surface models with inconsistent performance
- Last request: when the model was last called
Step 8: review audit logs
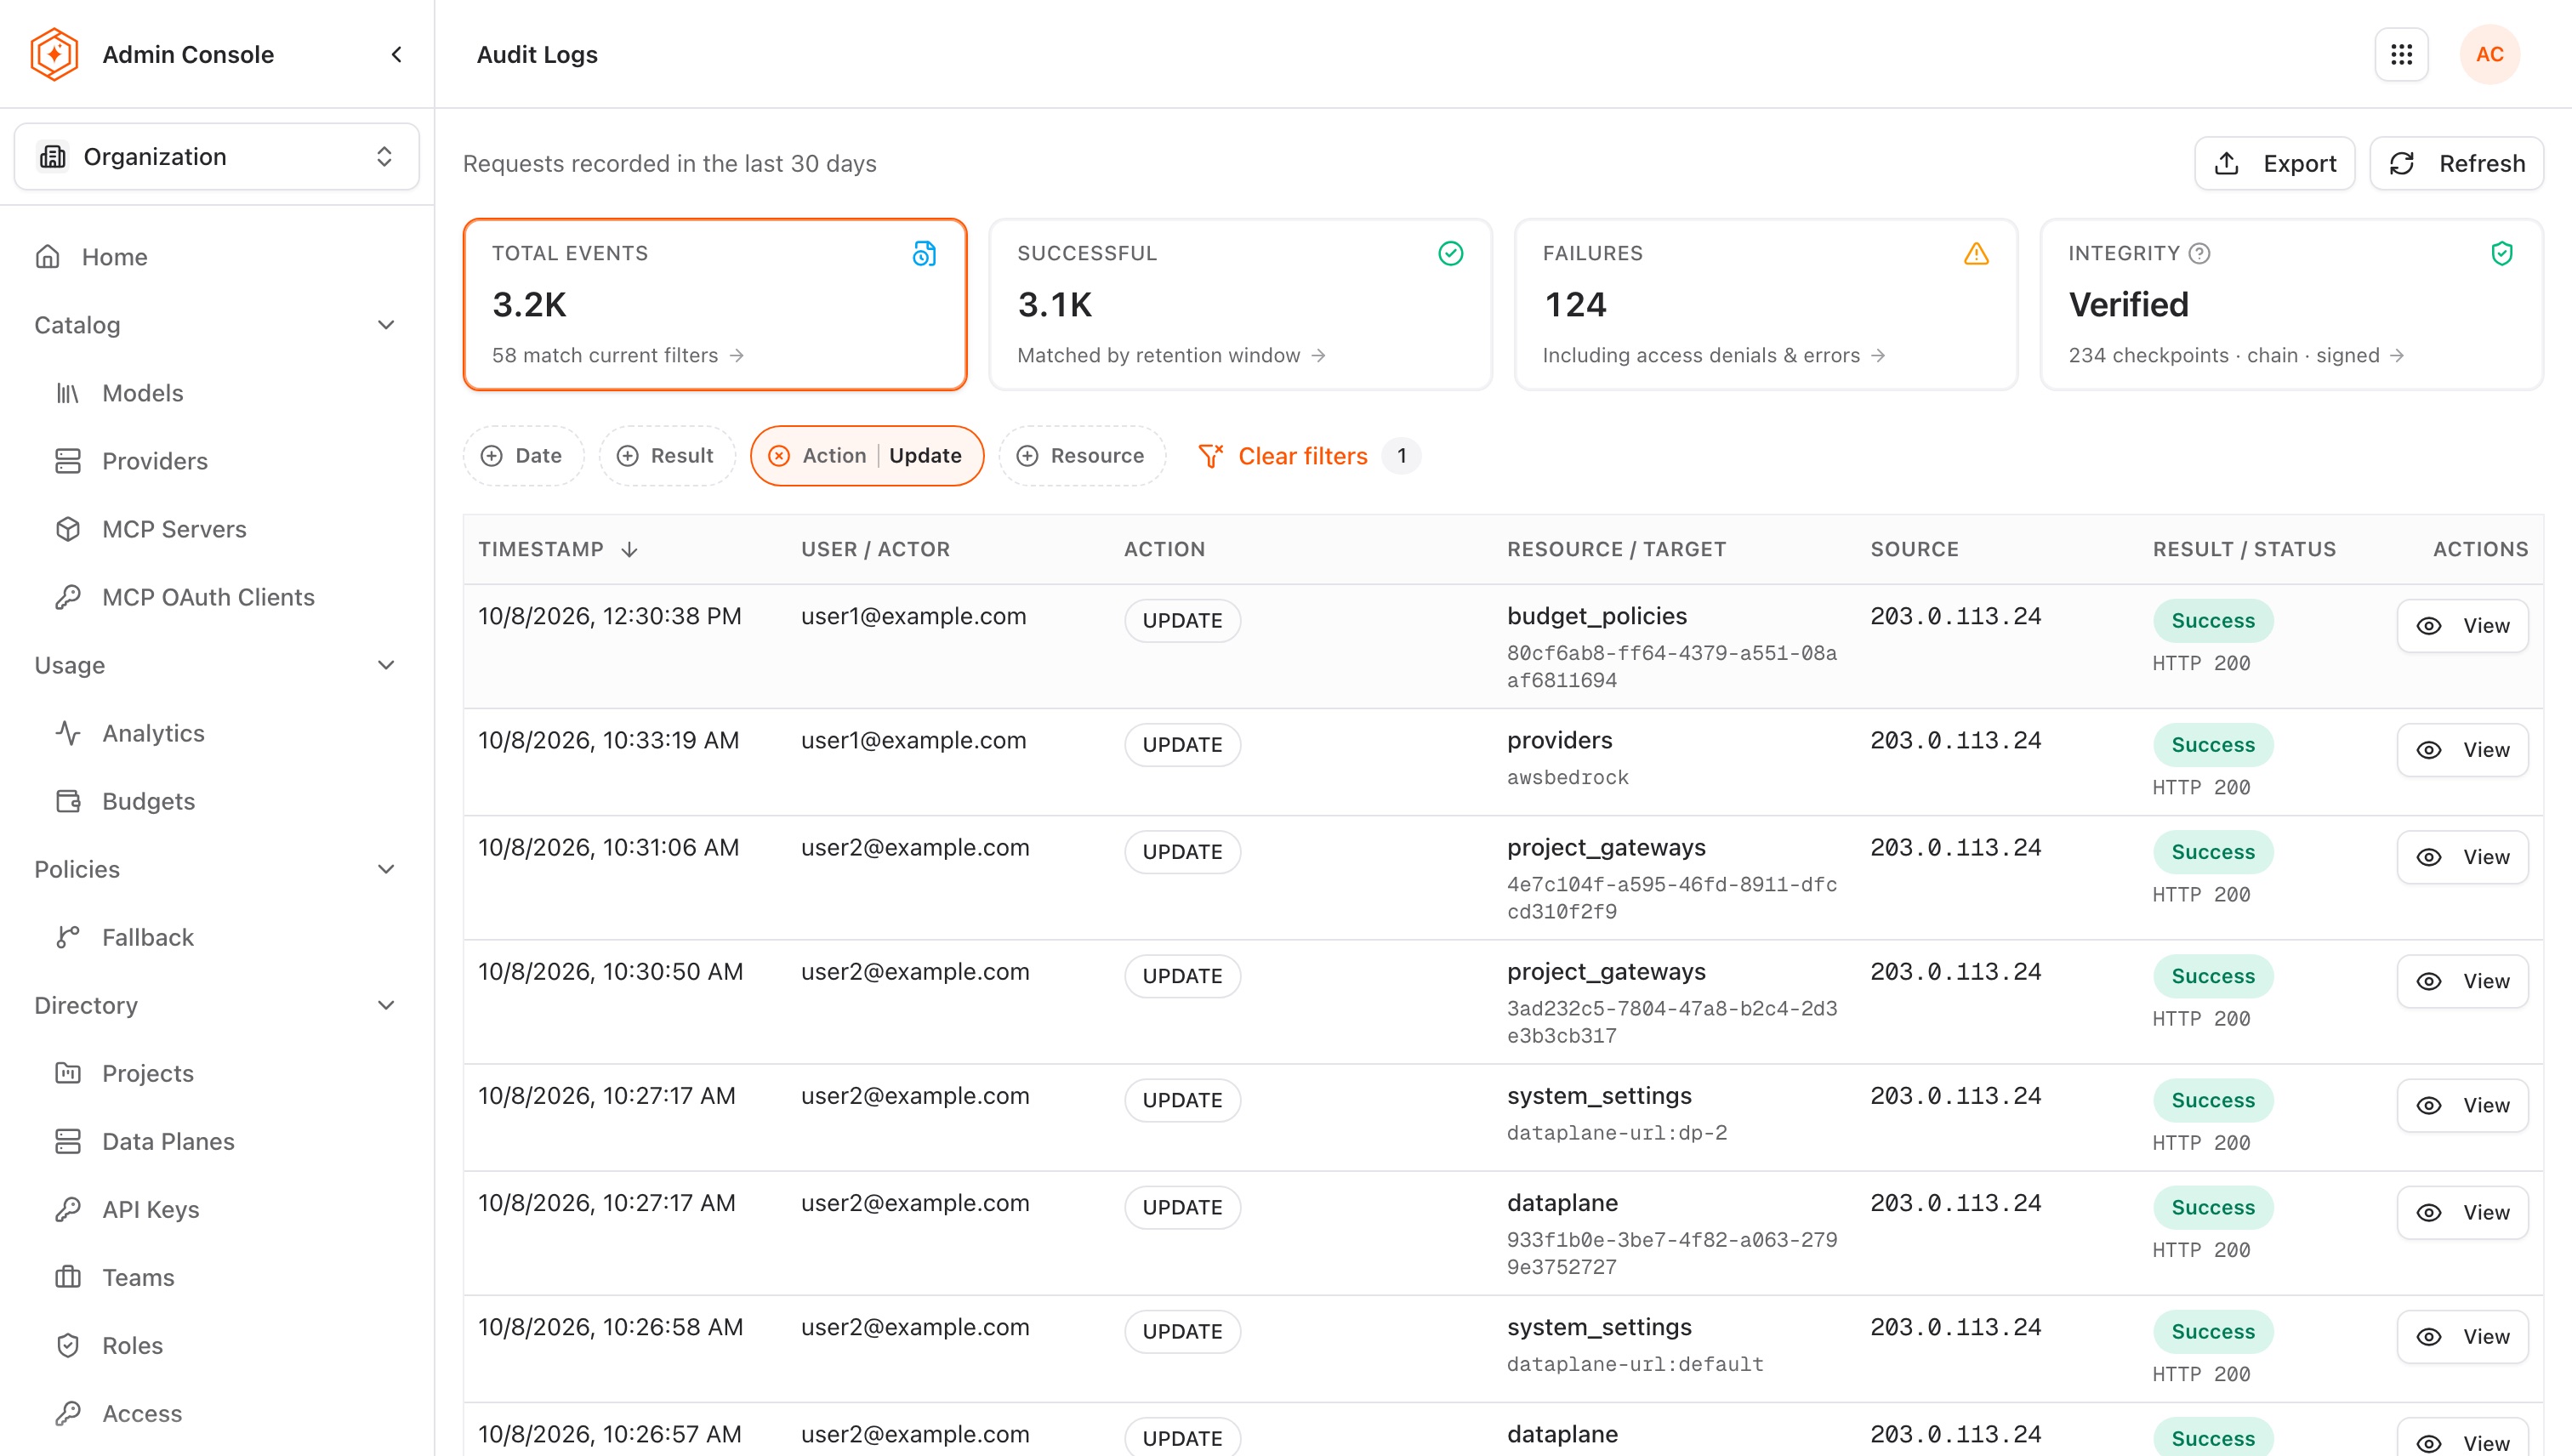
Audit Logs record every administrative action taken in the Admin Console: model changes, provider credential updates, user modifications, SSO configuration edits, and more. The log is tamper-resistant and provides a complete accountability trail suitable for compliance reporting and incident investigation.
-
Go to System → Audit Logs in the sidebar.
-
View a chronological history of administrative actions. Each entry records the actor, the action taken, the affected resource, and a precise timestamp. The Integrity card above the list reports whether the log's signed, chained checkpoints verify.
-
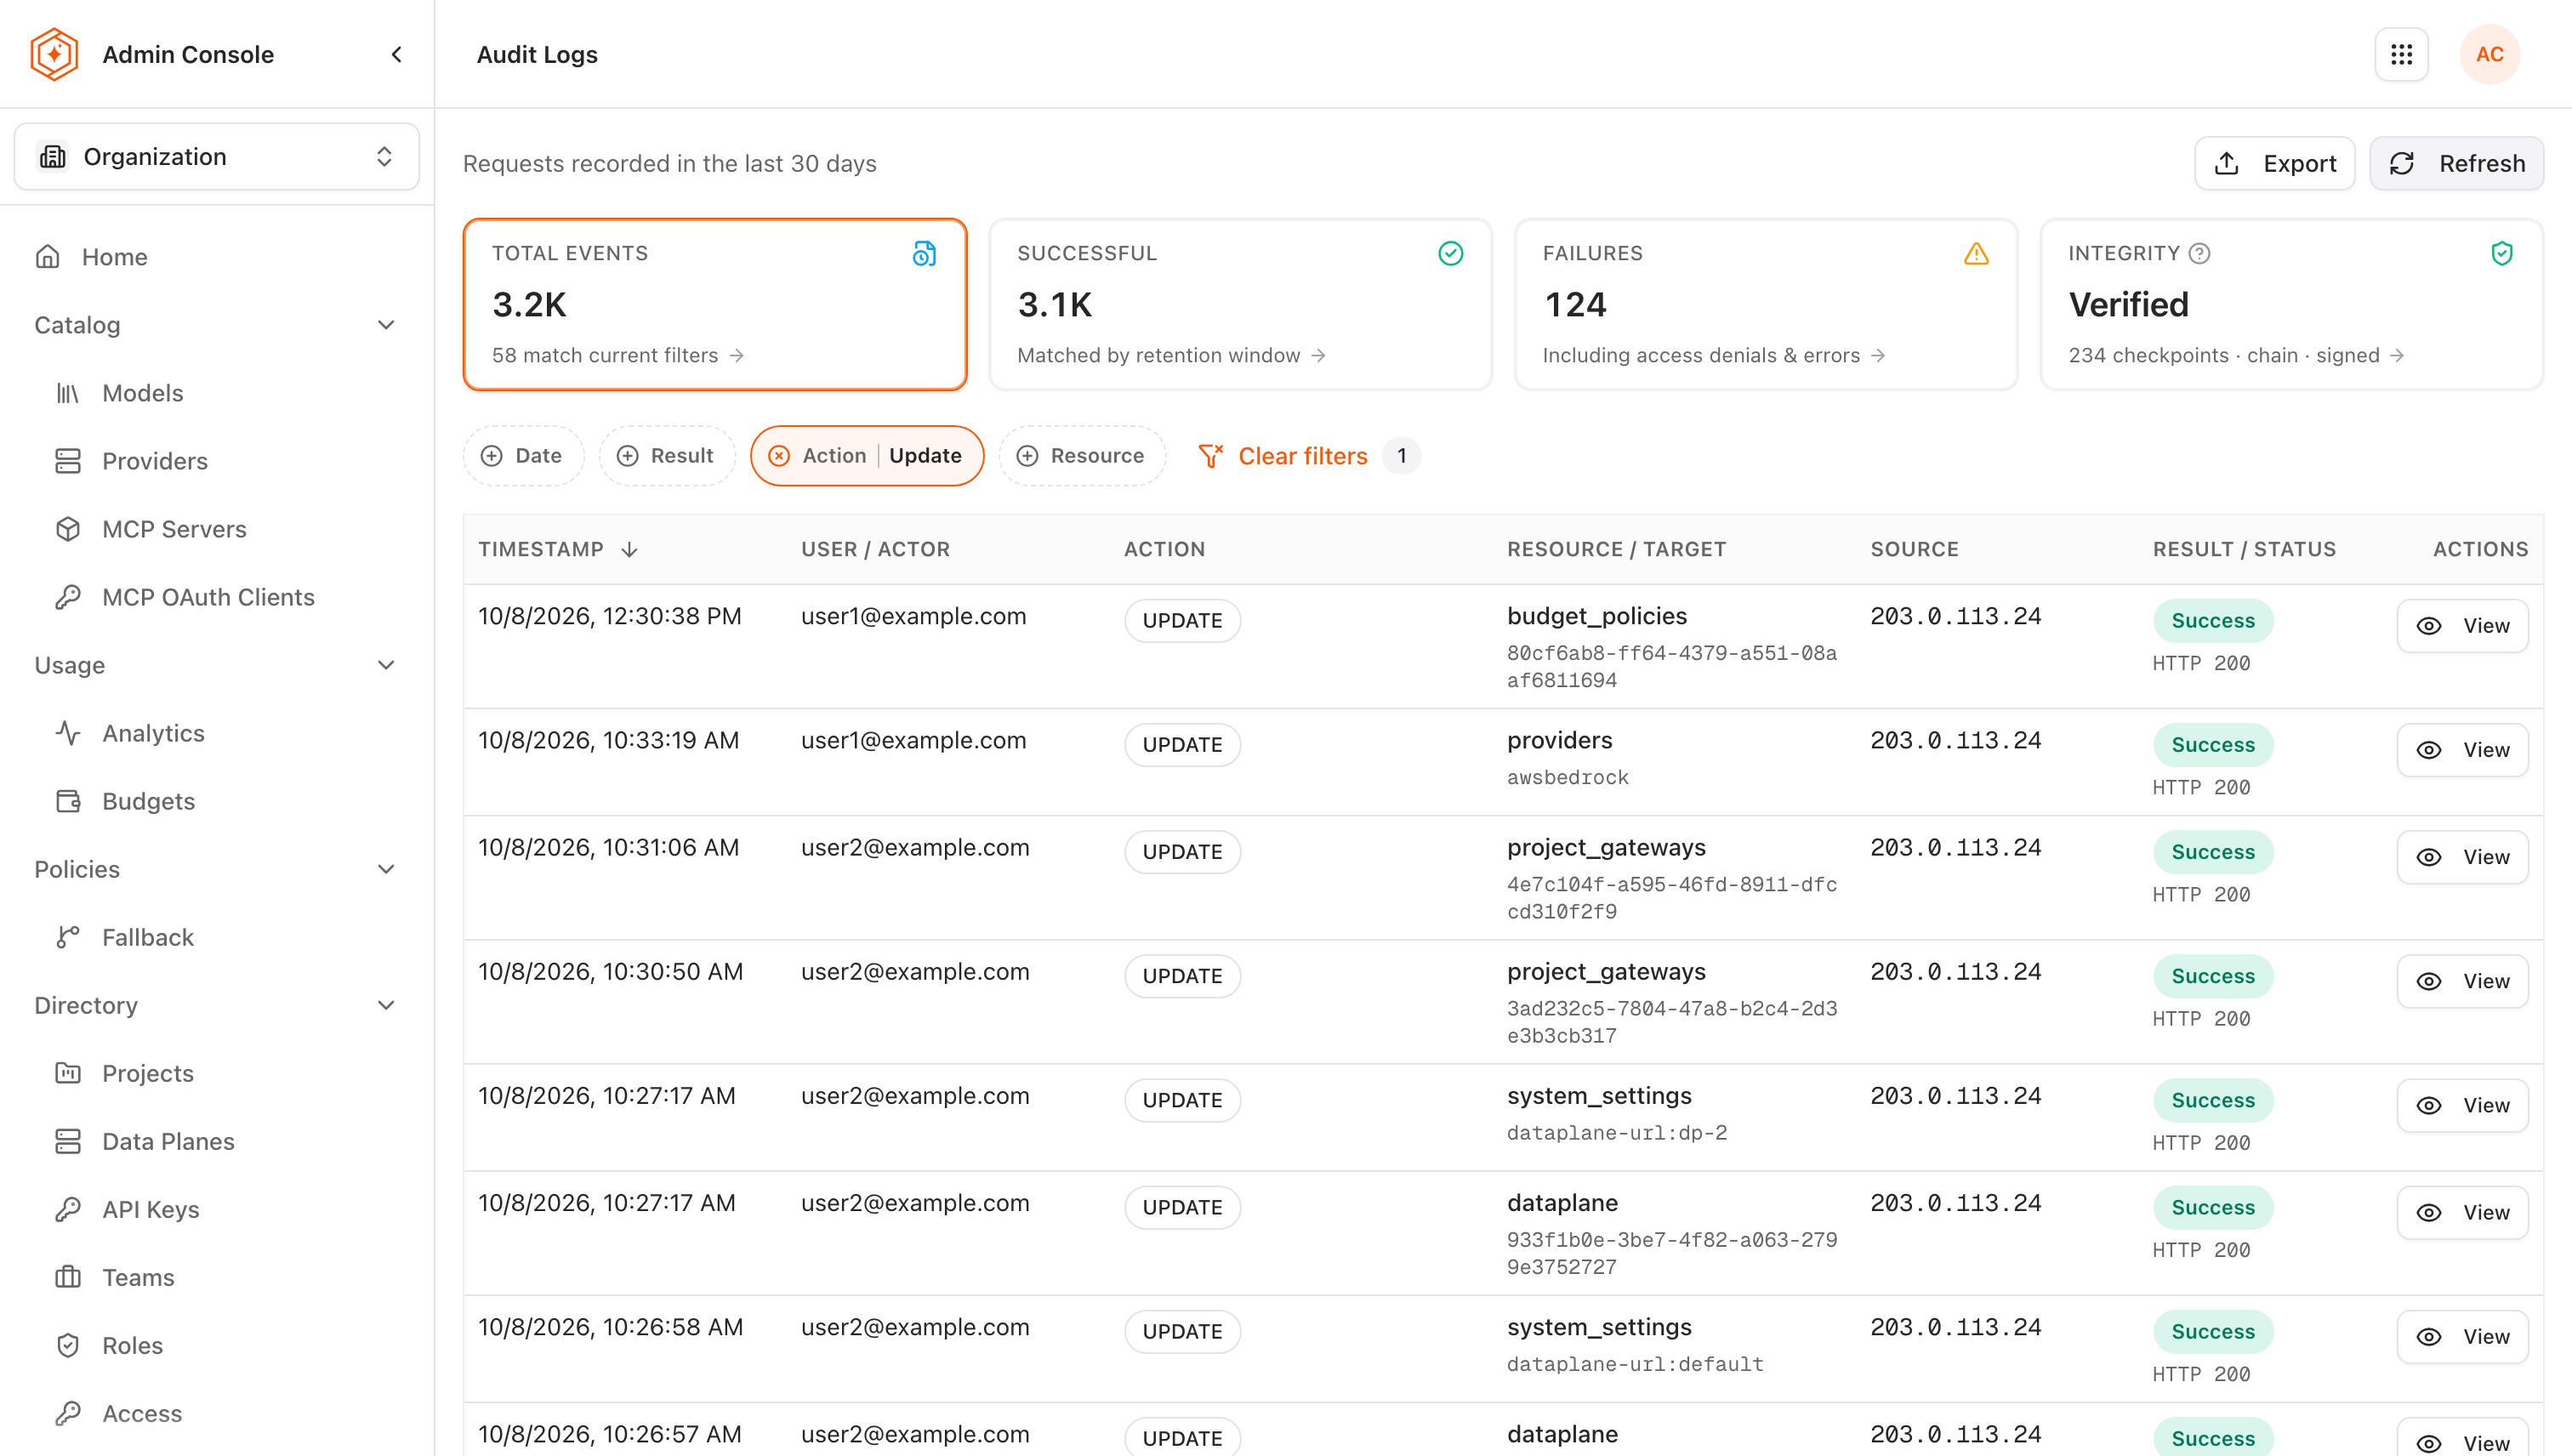
Click Refresh to load the latest entries.
-
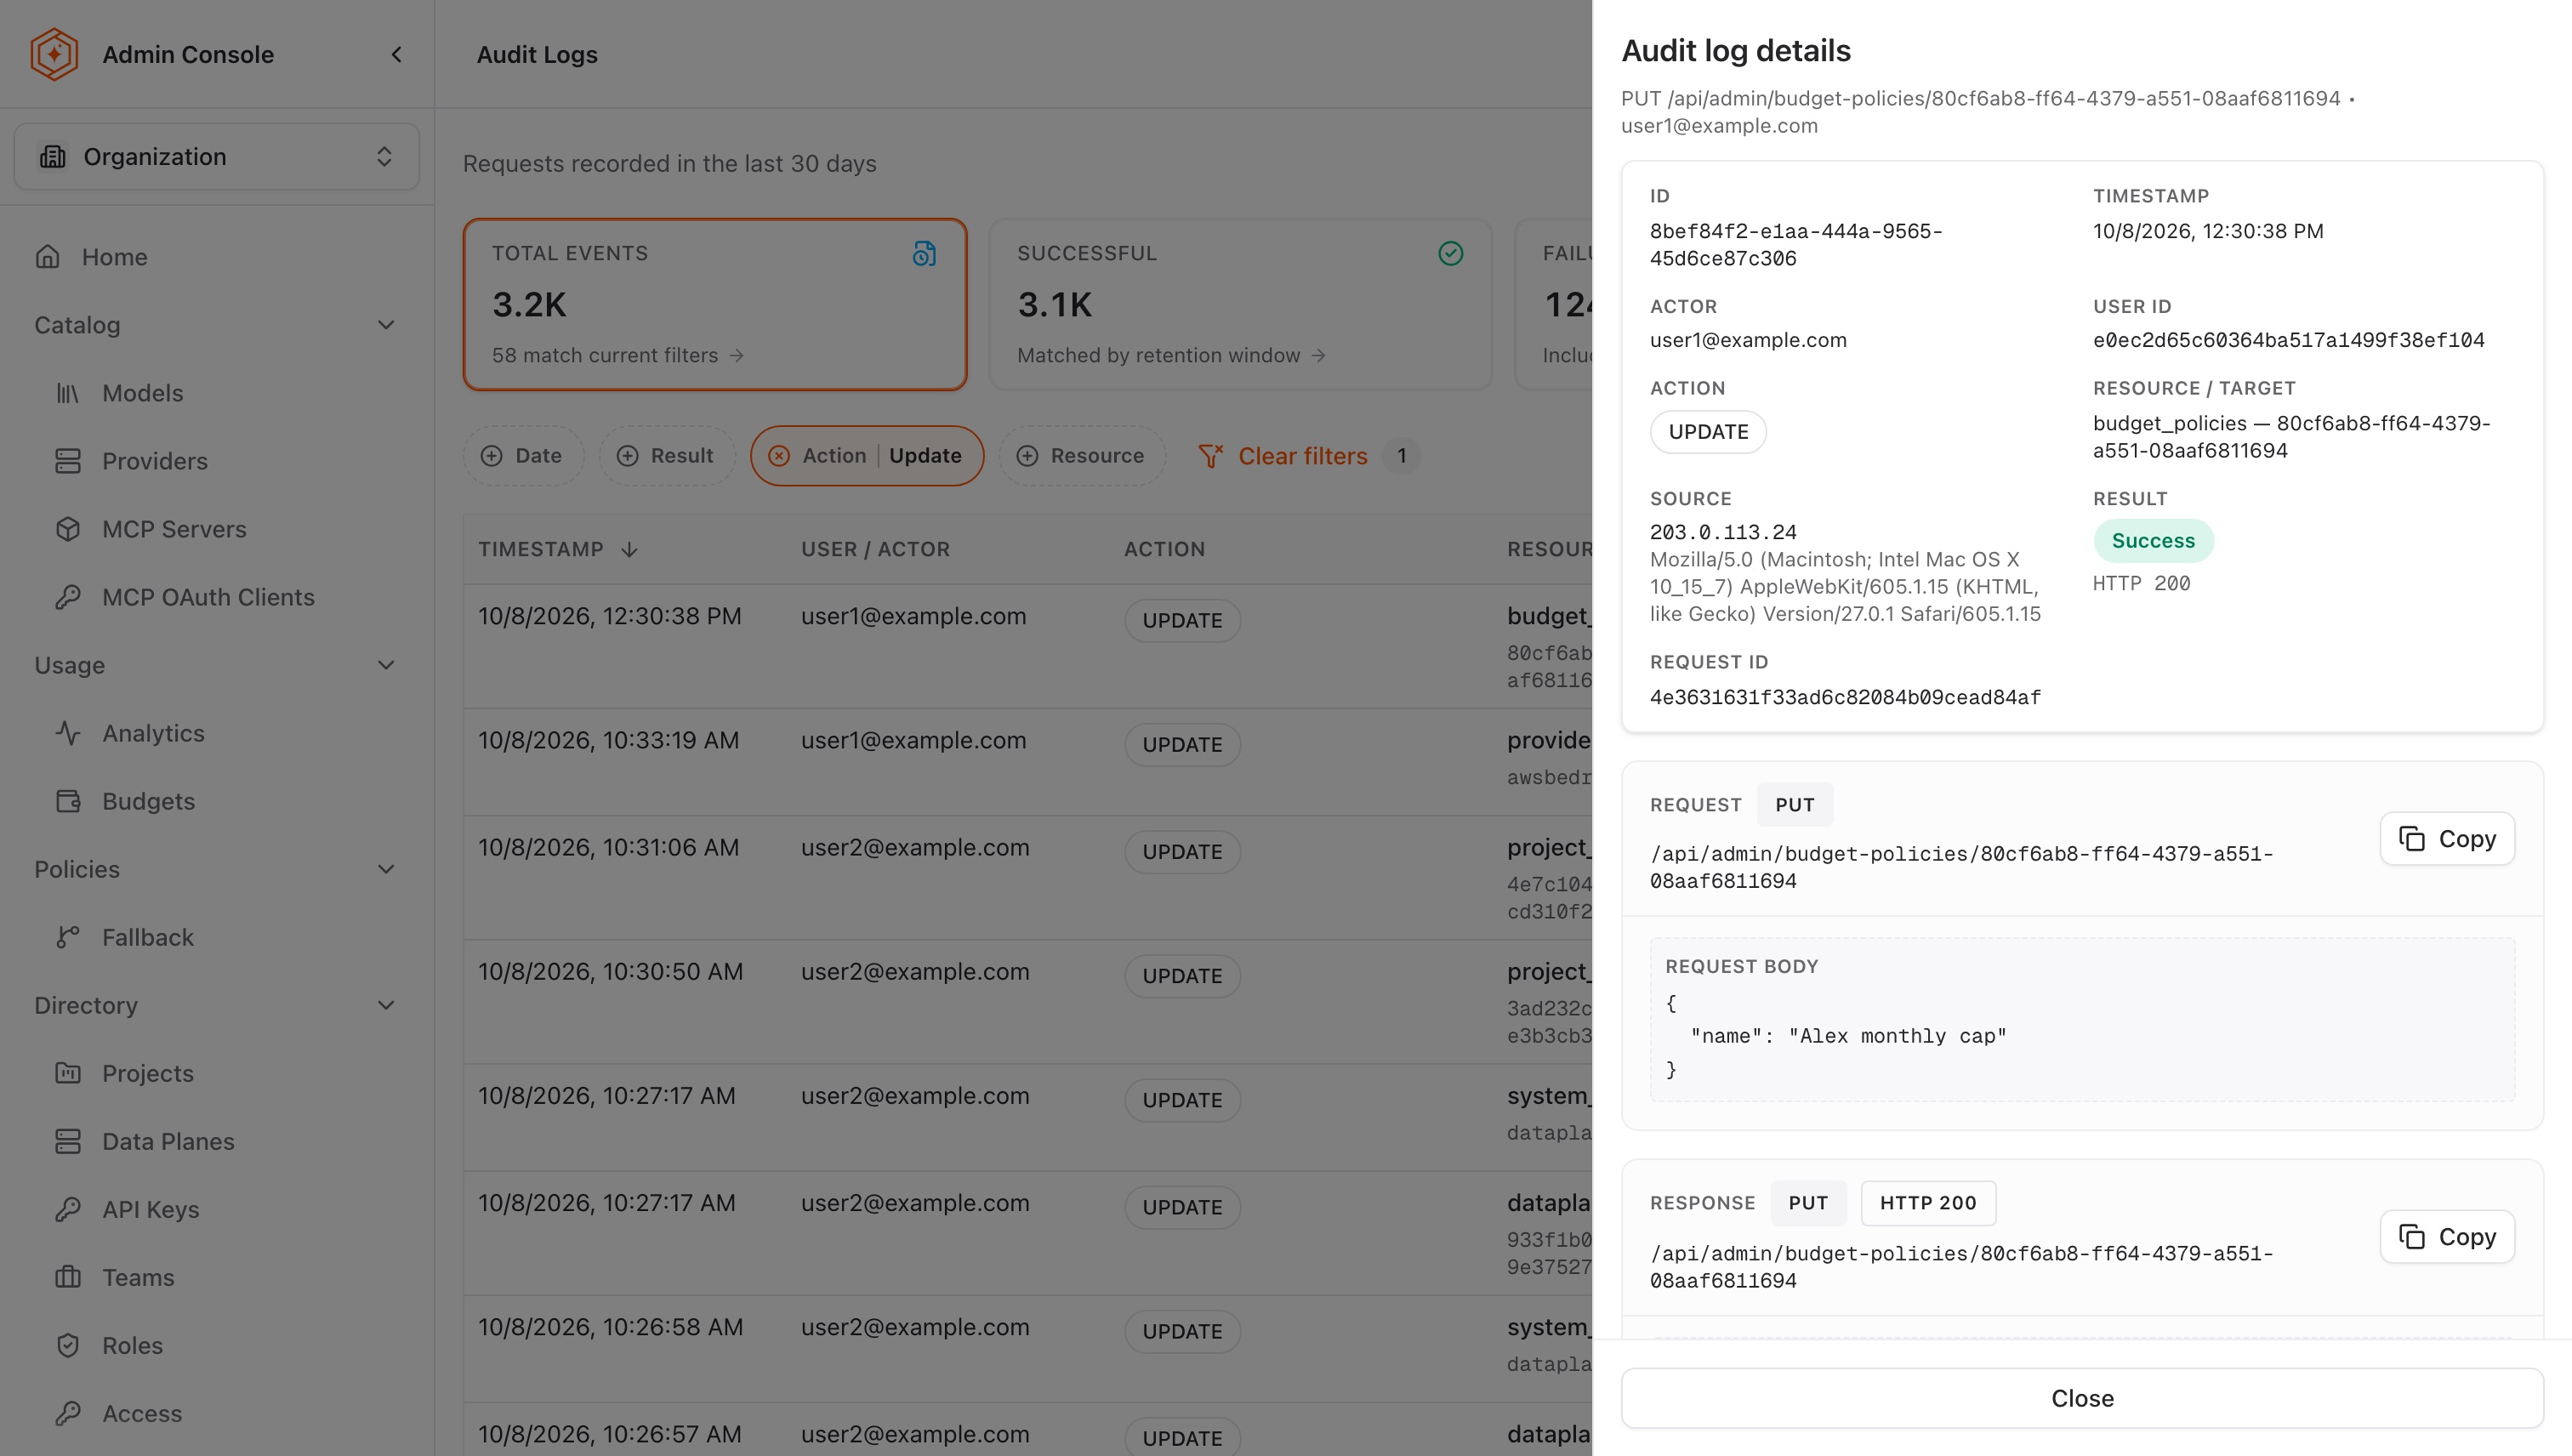
Click View on any entry to open its full details: the actor, source address and user agent, the request with its body, and the response. This is particularly useful when investigating unexpected configuration changes.
Evaluation checkpoint
- Signed in to the Admin Console
- Confirmed the default project is served by the managed data plane at the expected address, and has the correct project membership, provider connection, and enabled project models
- Reviewed the model catalog and understand how to enable and disable models
- Confirmed that all provider connections are healthy
- Reviewed the user list and verified role assignments are correct
- Reviewed organization-wide usage analytics and identified top consumers
- Reviewed per-model request counts and latency metrics
- Reviewed audit logs and understand what actions are captured
Where to go next