Developer Console quickstart
Ten minutes from sign-in to a first routed AI request. By the end: an API key, a proxy endpoint URL, a working request in at least one language, and a verified entry in Request Logs.
The screenshots in this guide use the example tenant name acme. The URL in a production environment resembles router.<custom-name>.tetrate.ai and differs between production and non-production deployments.
Step 1: sign in
-
Go to the Console URL (for example
https://router.acme.tetrate.ai).
-
Click Sign In with Corporate SSO, then enter the credentials the organization's identity provider asks for (commonly a username and password).
-
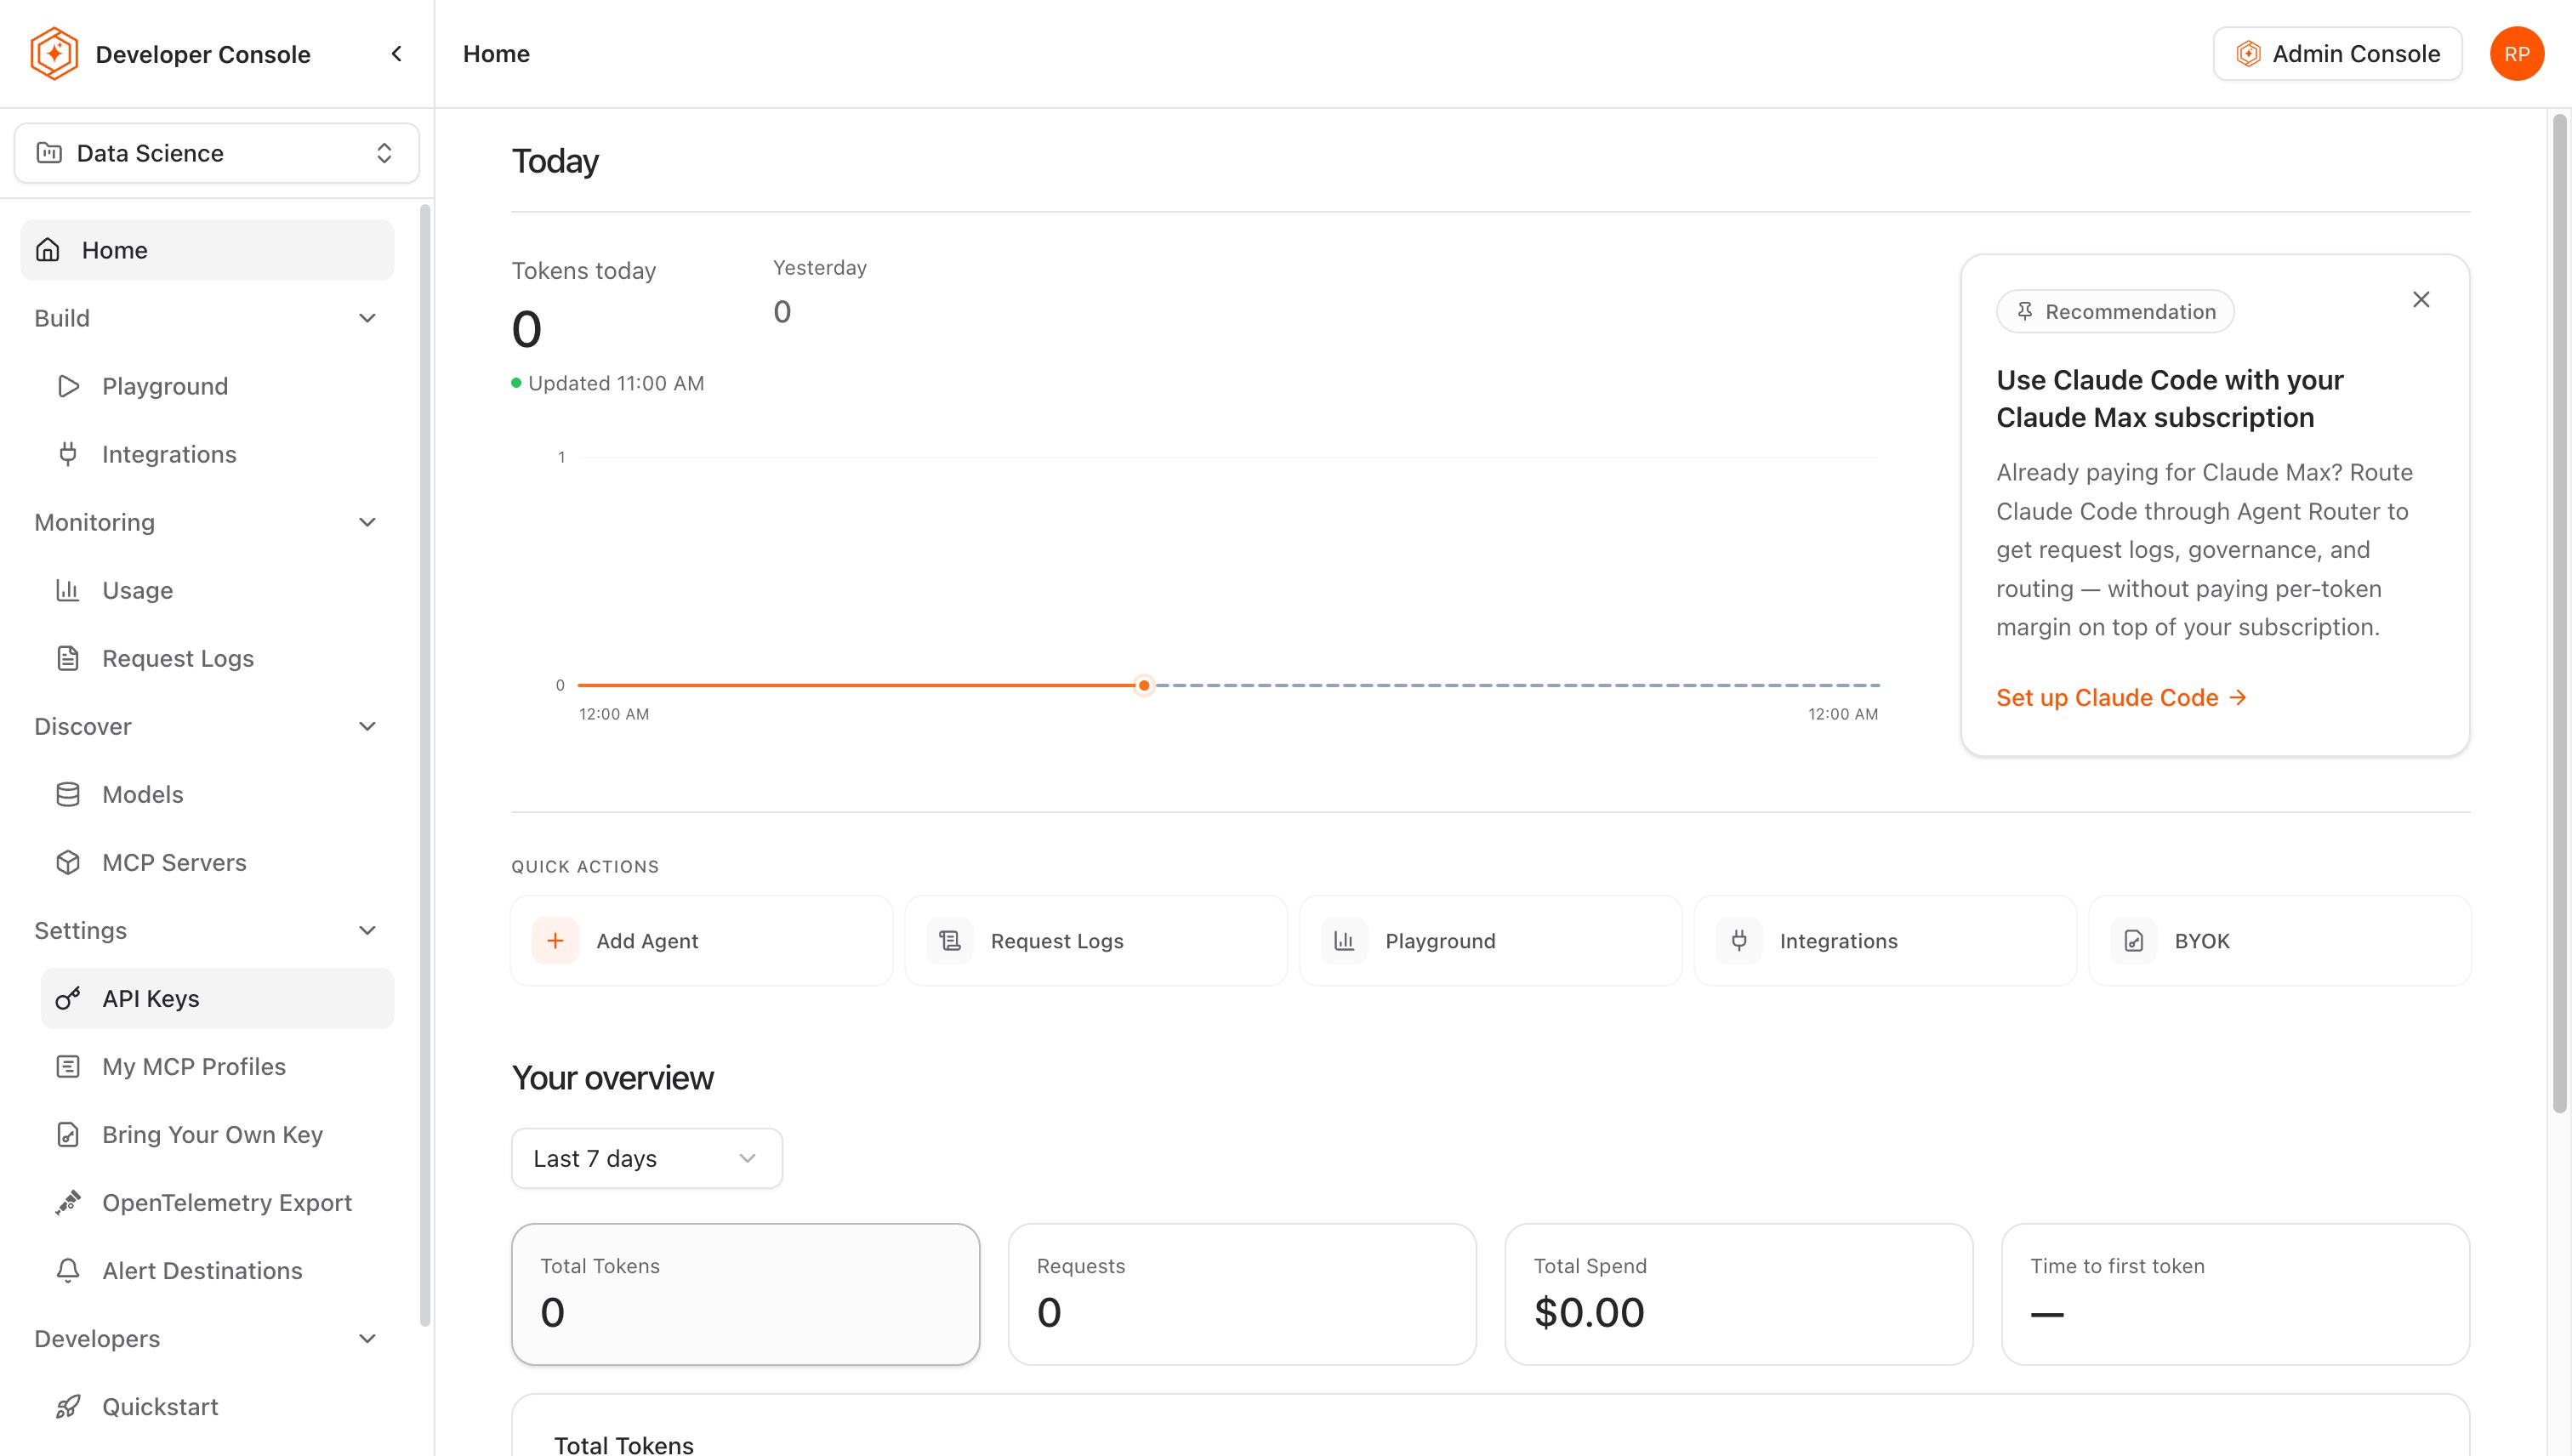
The Home page opens, showing today's token usage, quick actions, and an overview of recent activity for the selected project.
Step 2: create an API key
API keys authenticate an application's requests to the gateway. Each key can be assigned its own fallback and traffic-splitting policies and rate limits. This quickstart creates a basic key with default settings.
An inference key can be created only in a project that a data plane serves. In a project with none, the API Keys page shows Base URL is not configured yet and key creation is refused; see "No data plane serves this project yet".
-
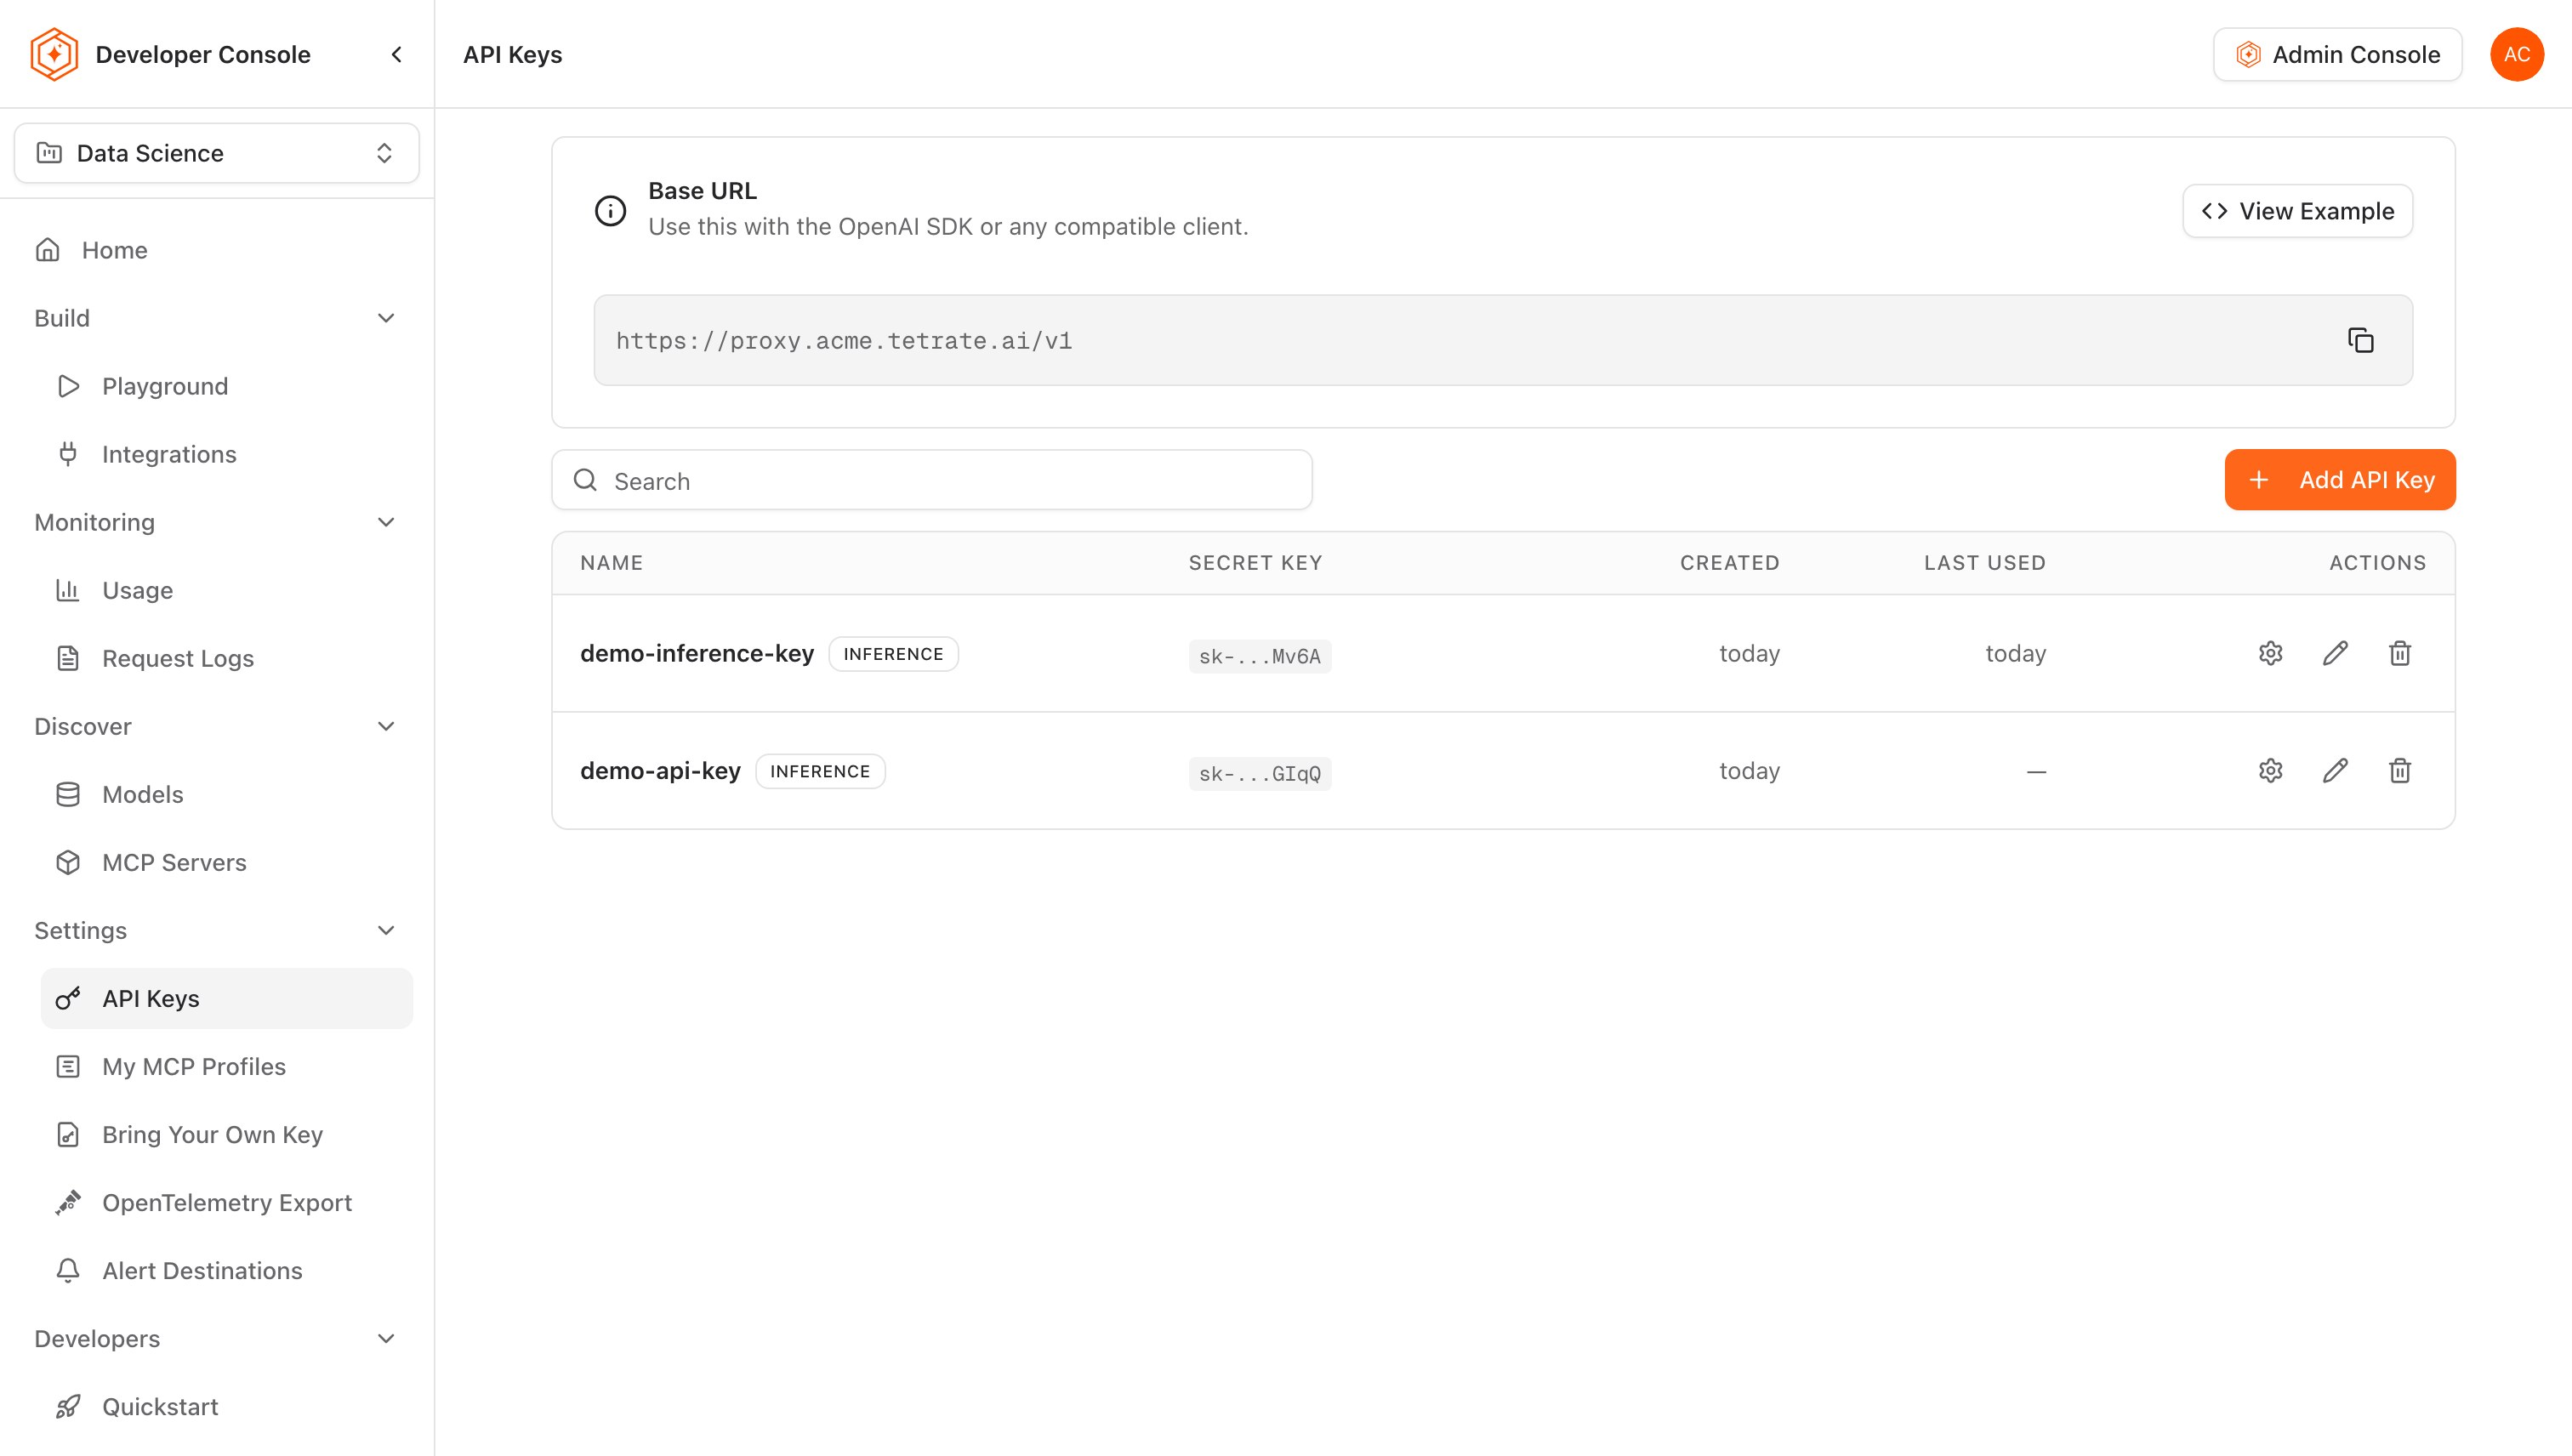
In the sidebar, click API Keys.
-
Click Add API Key.
-
Leave Key type on Inference Key and enter a name that identifies the application or workload the key serves (for example
my-agent-router-key). Keys are identified by name in logs and usage reports.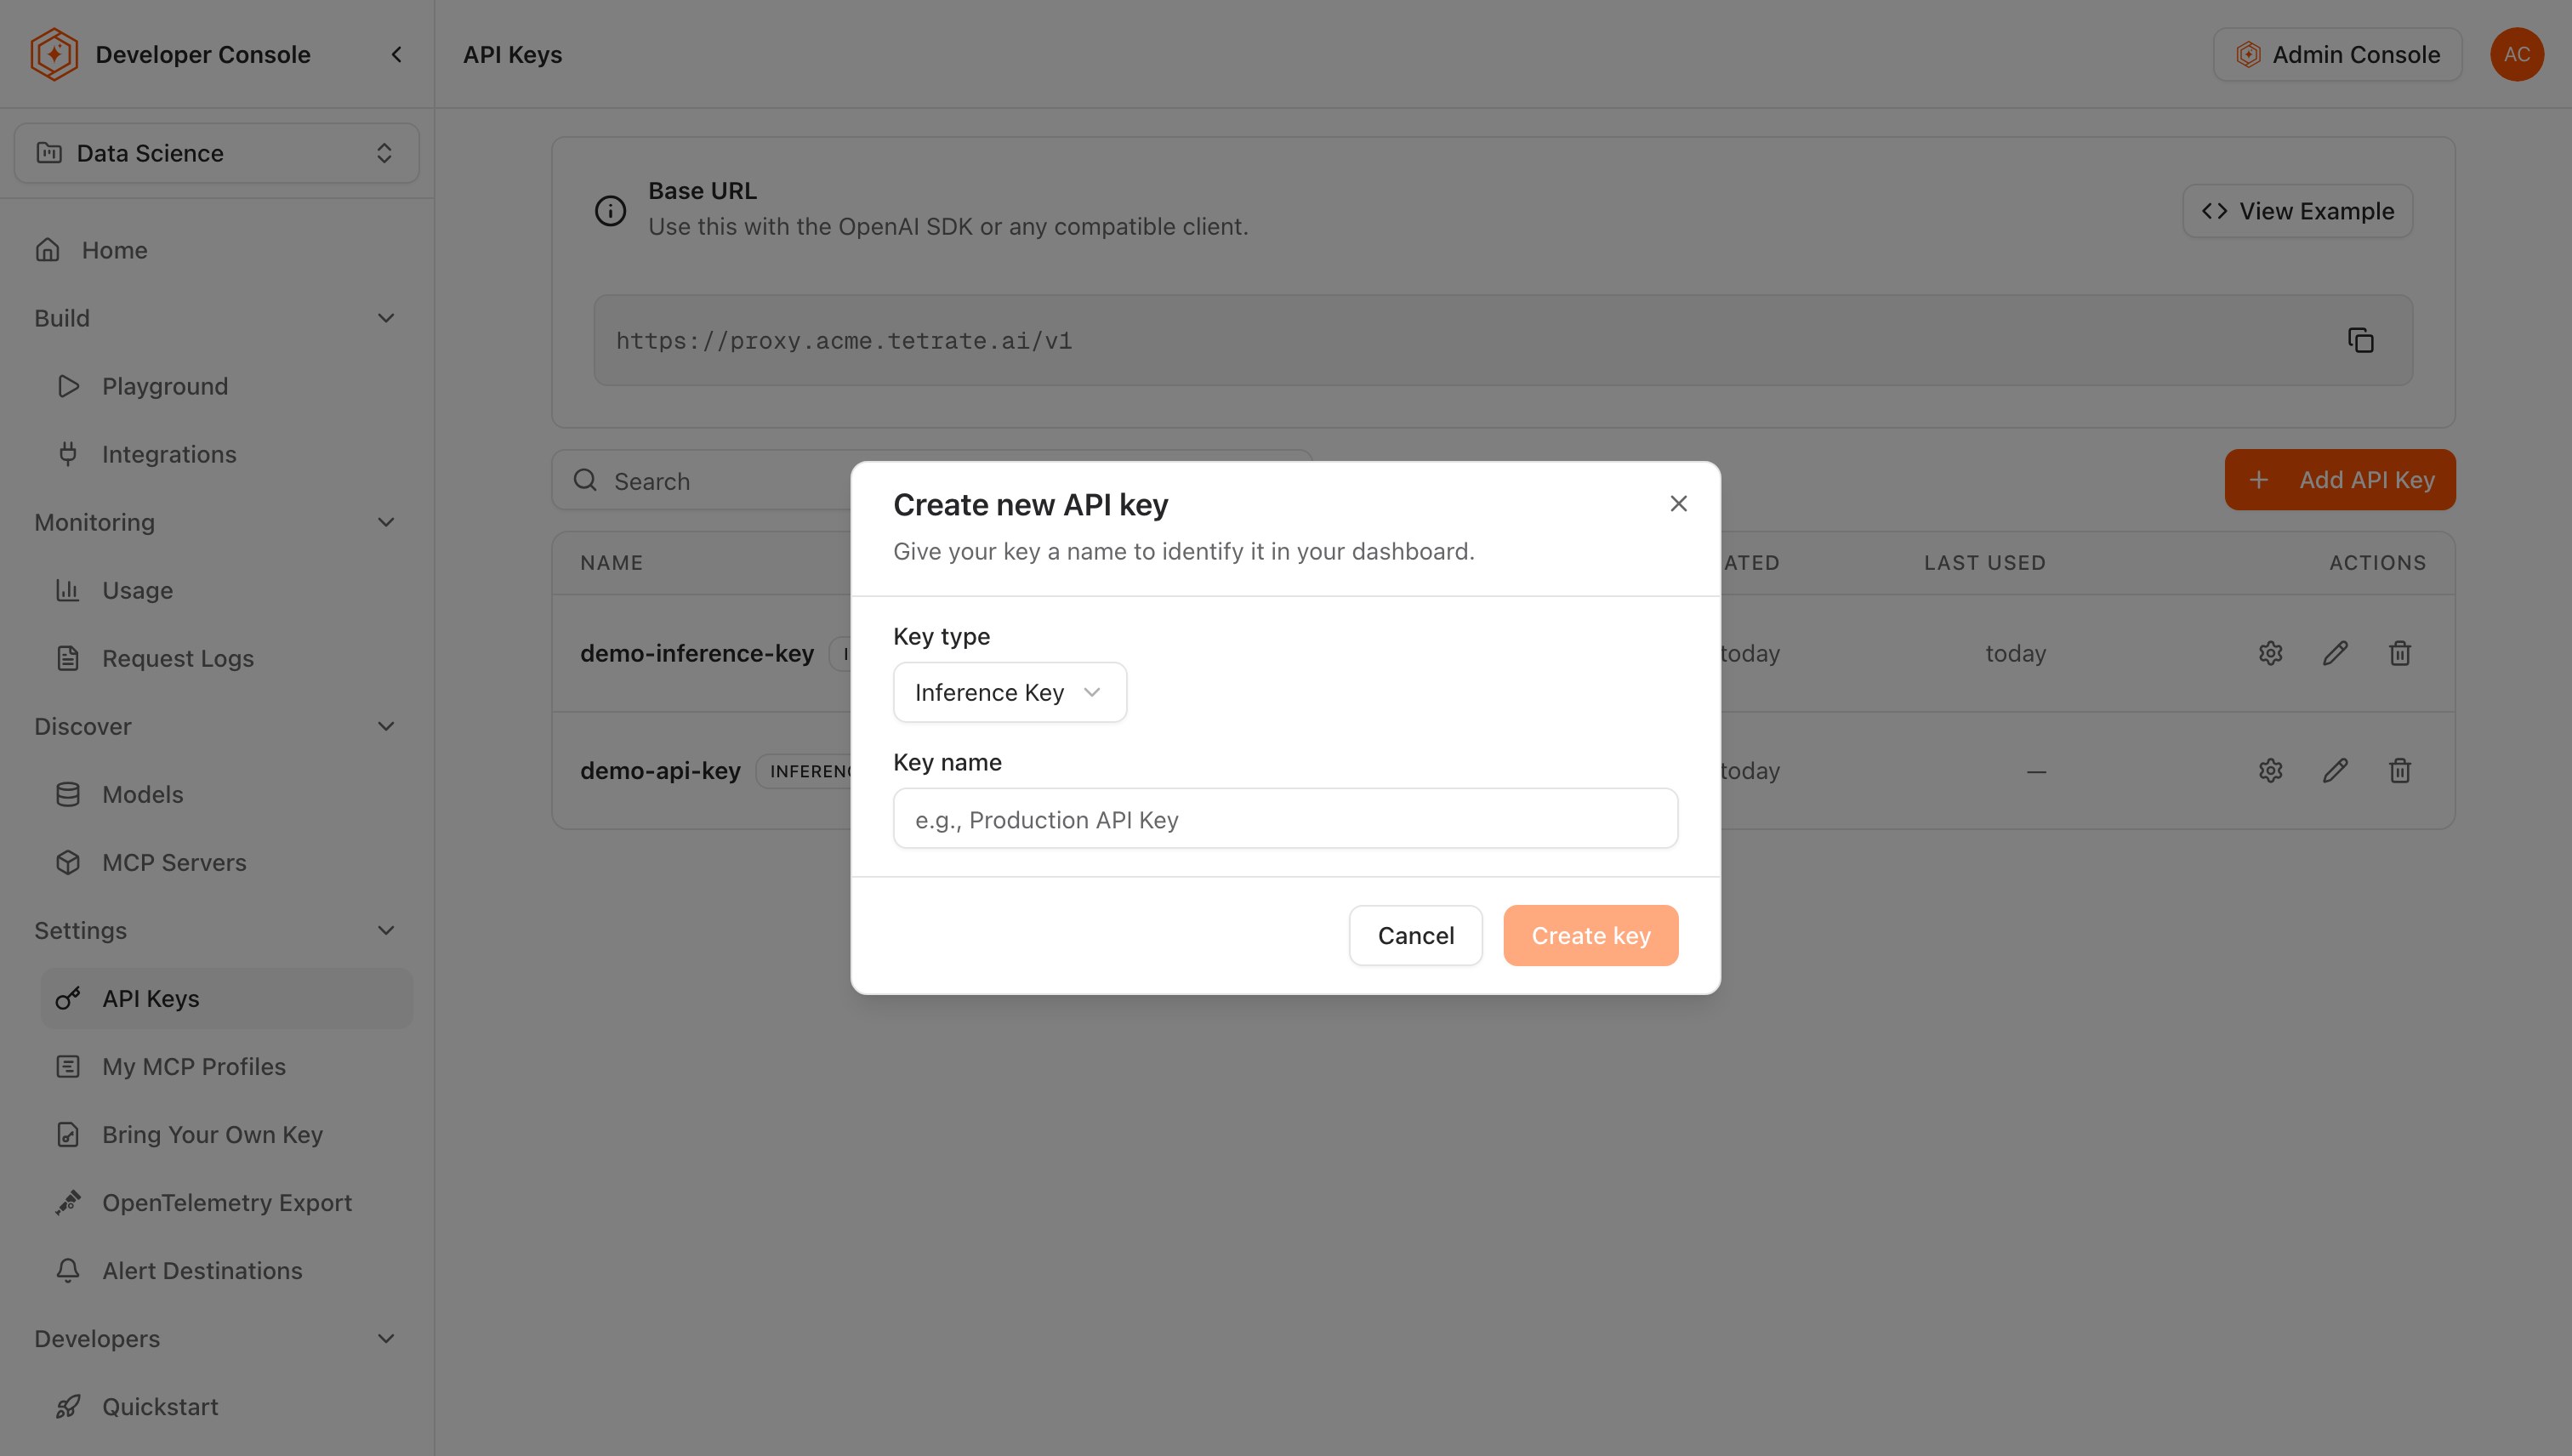
-
Click Create key.
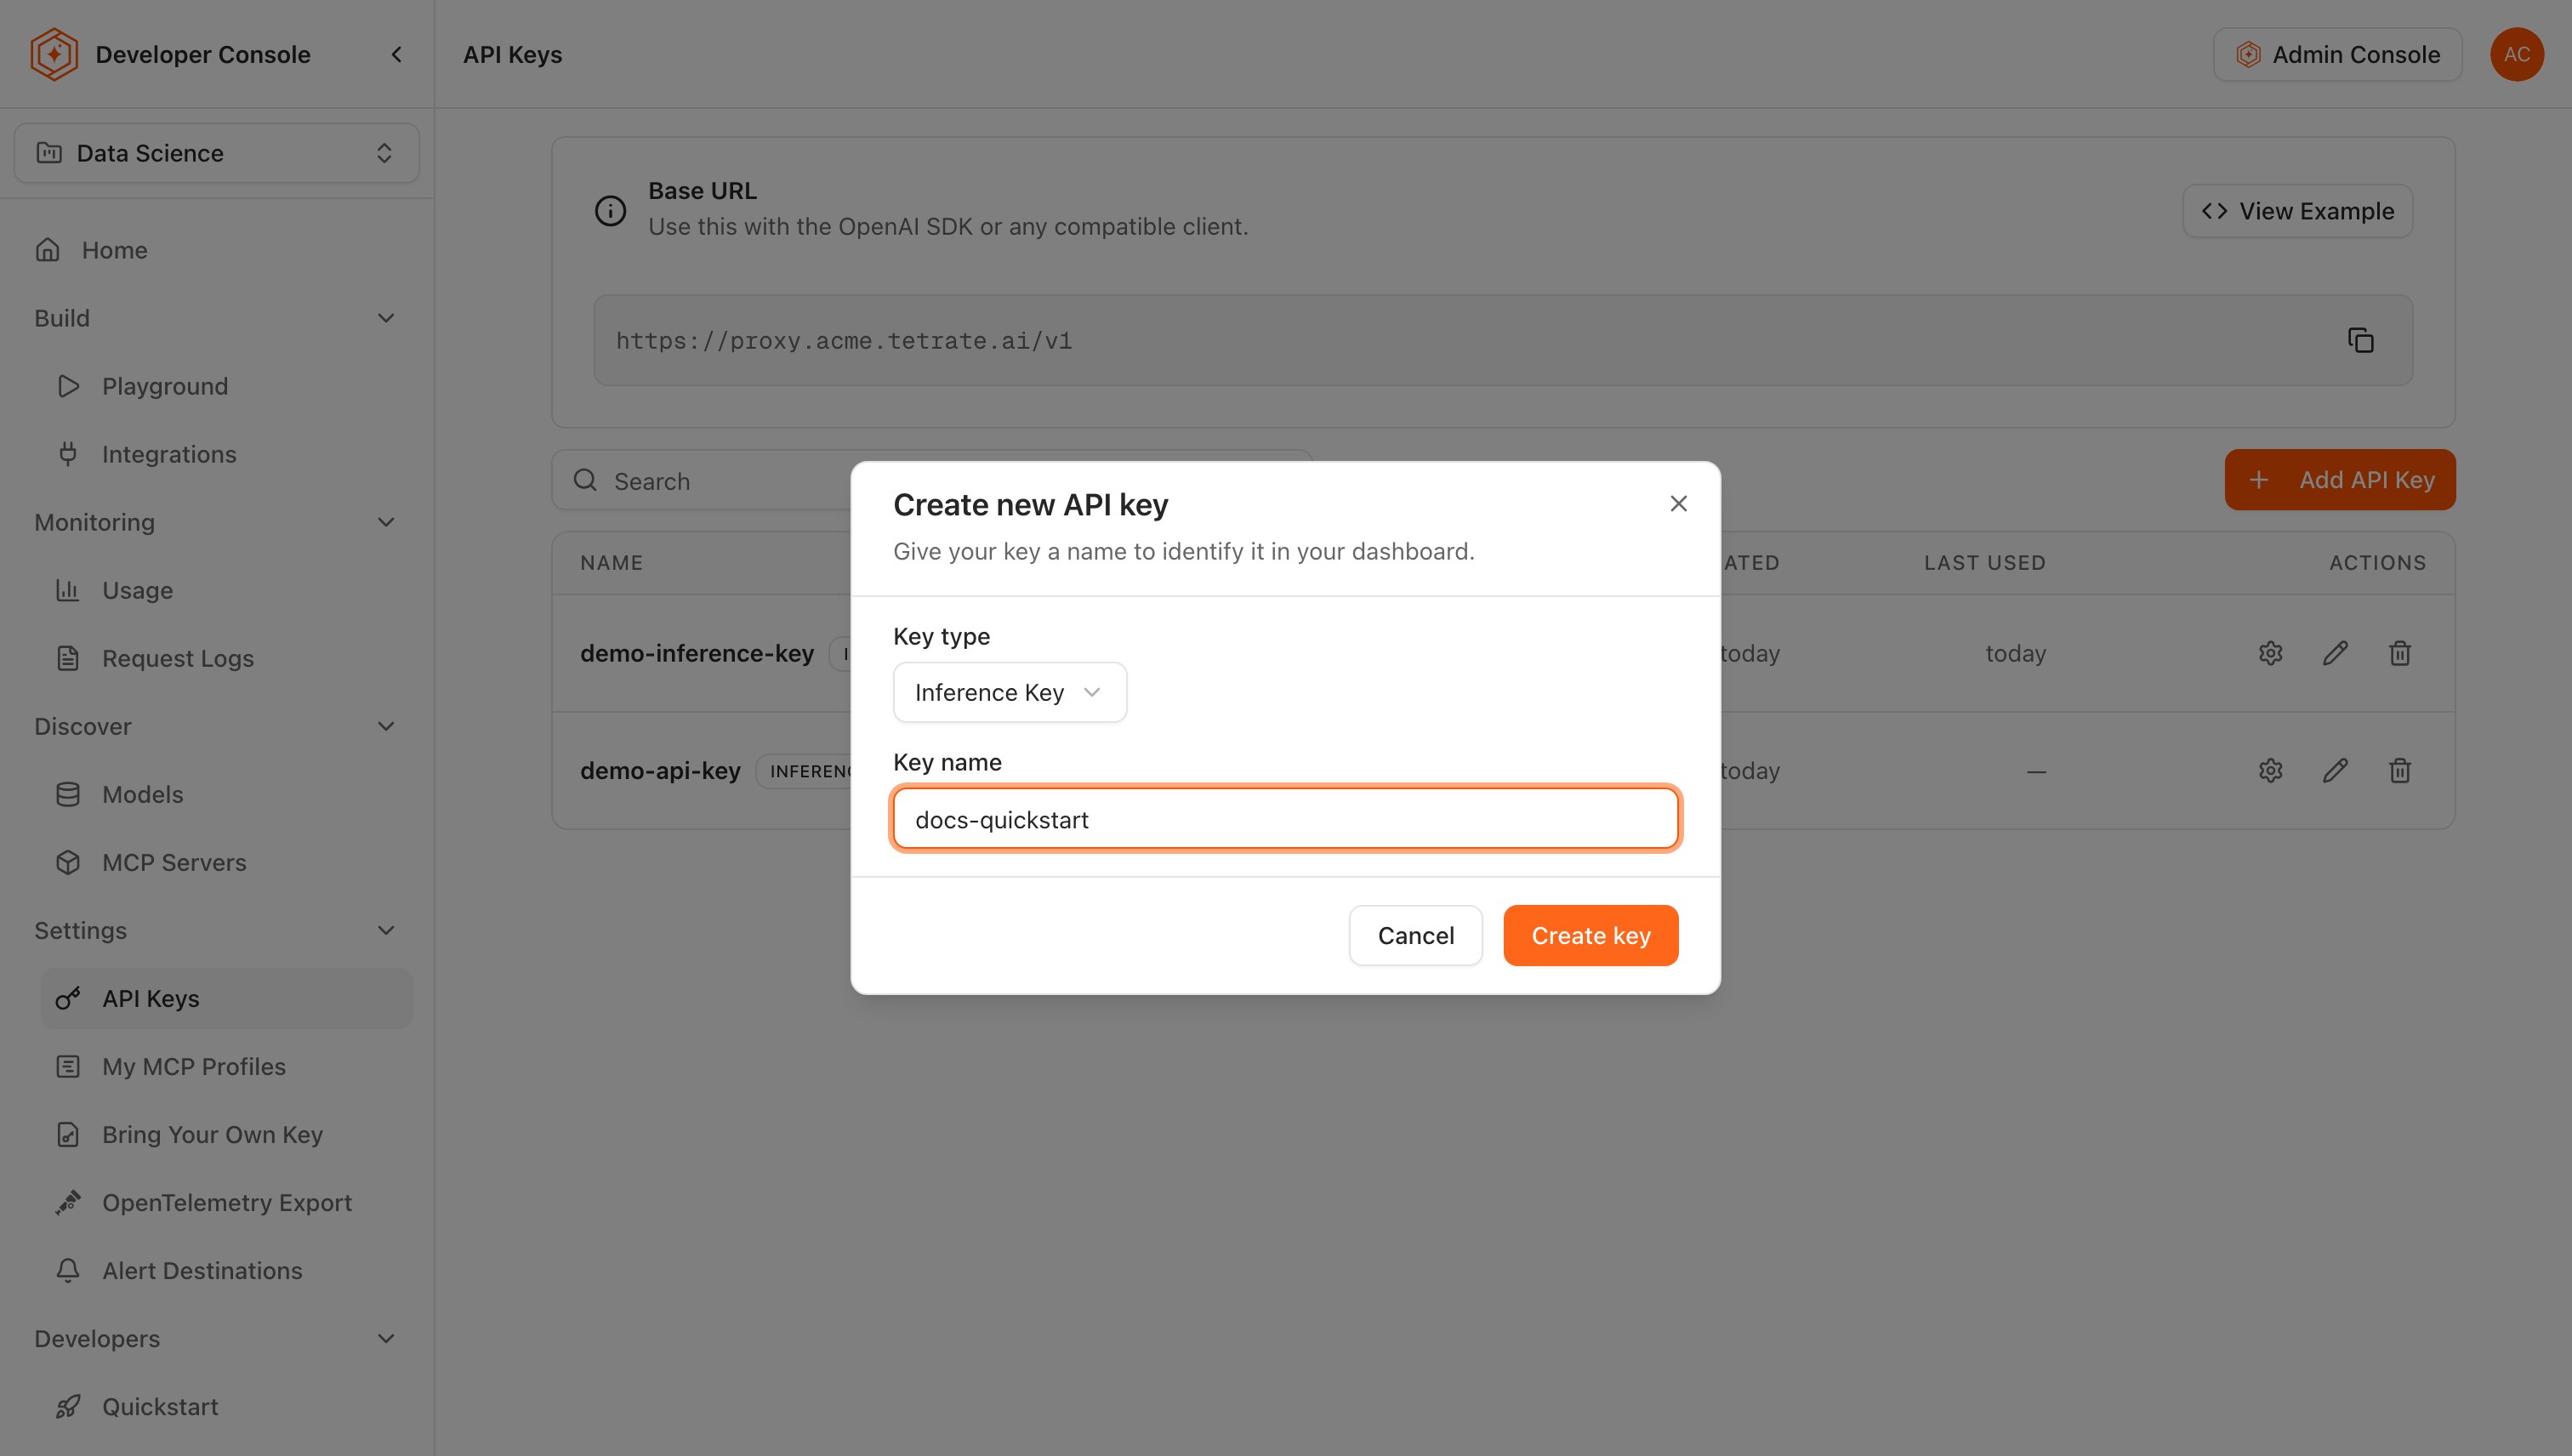
-
Copy the generated key immediately. This is the only time the key value is displayed. The dialog also shows the Base URL used in Step 3.
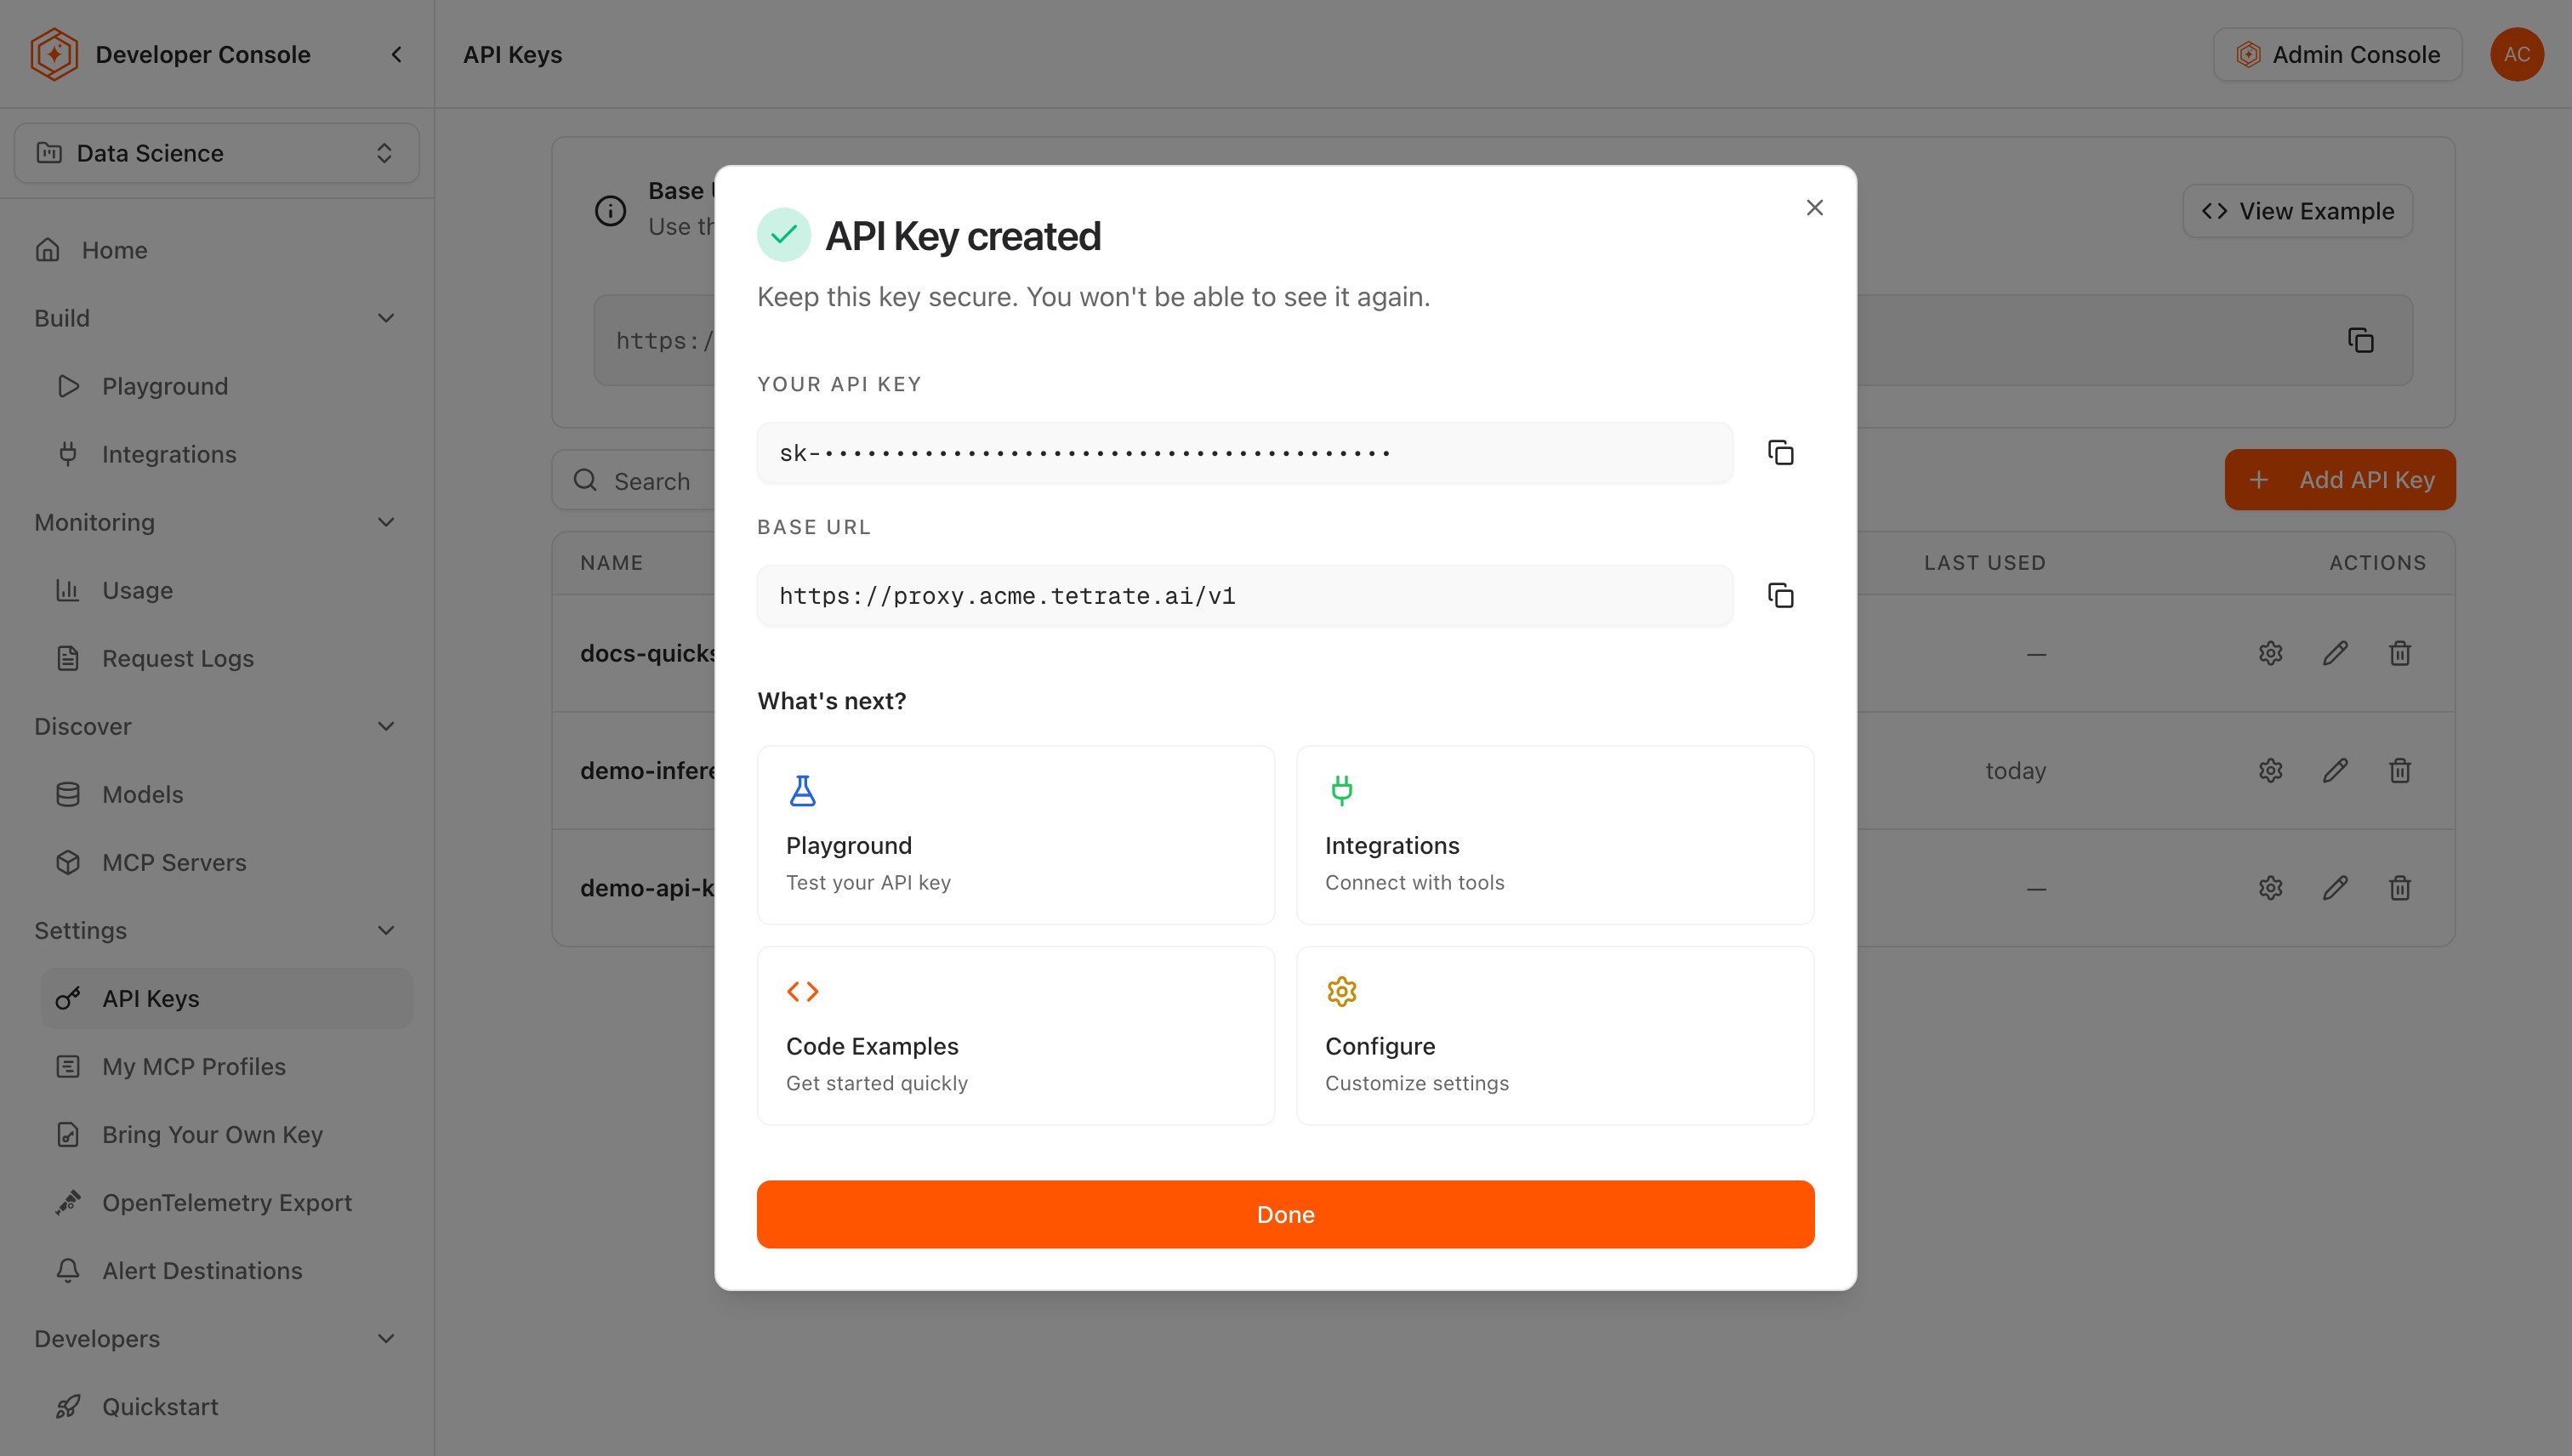
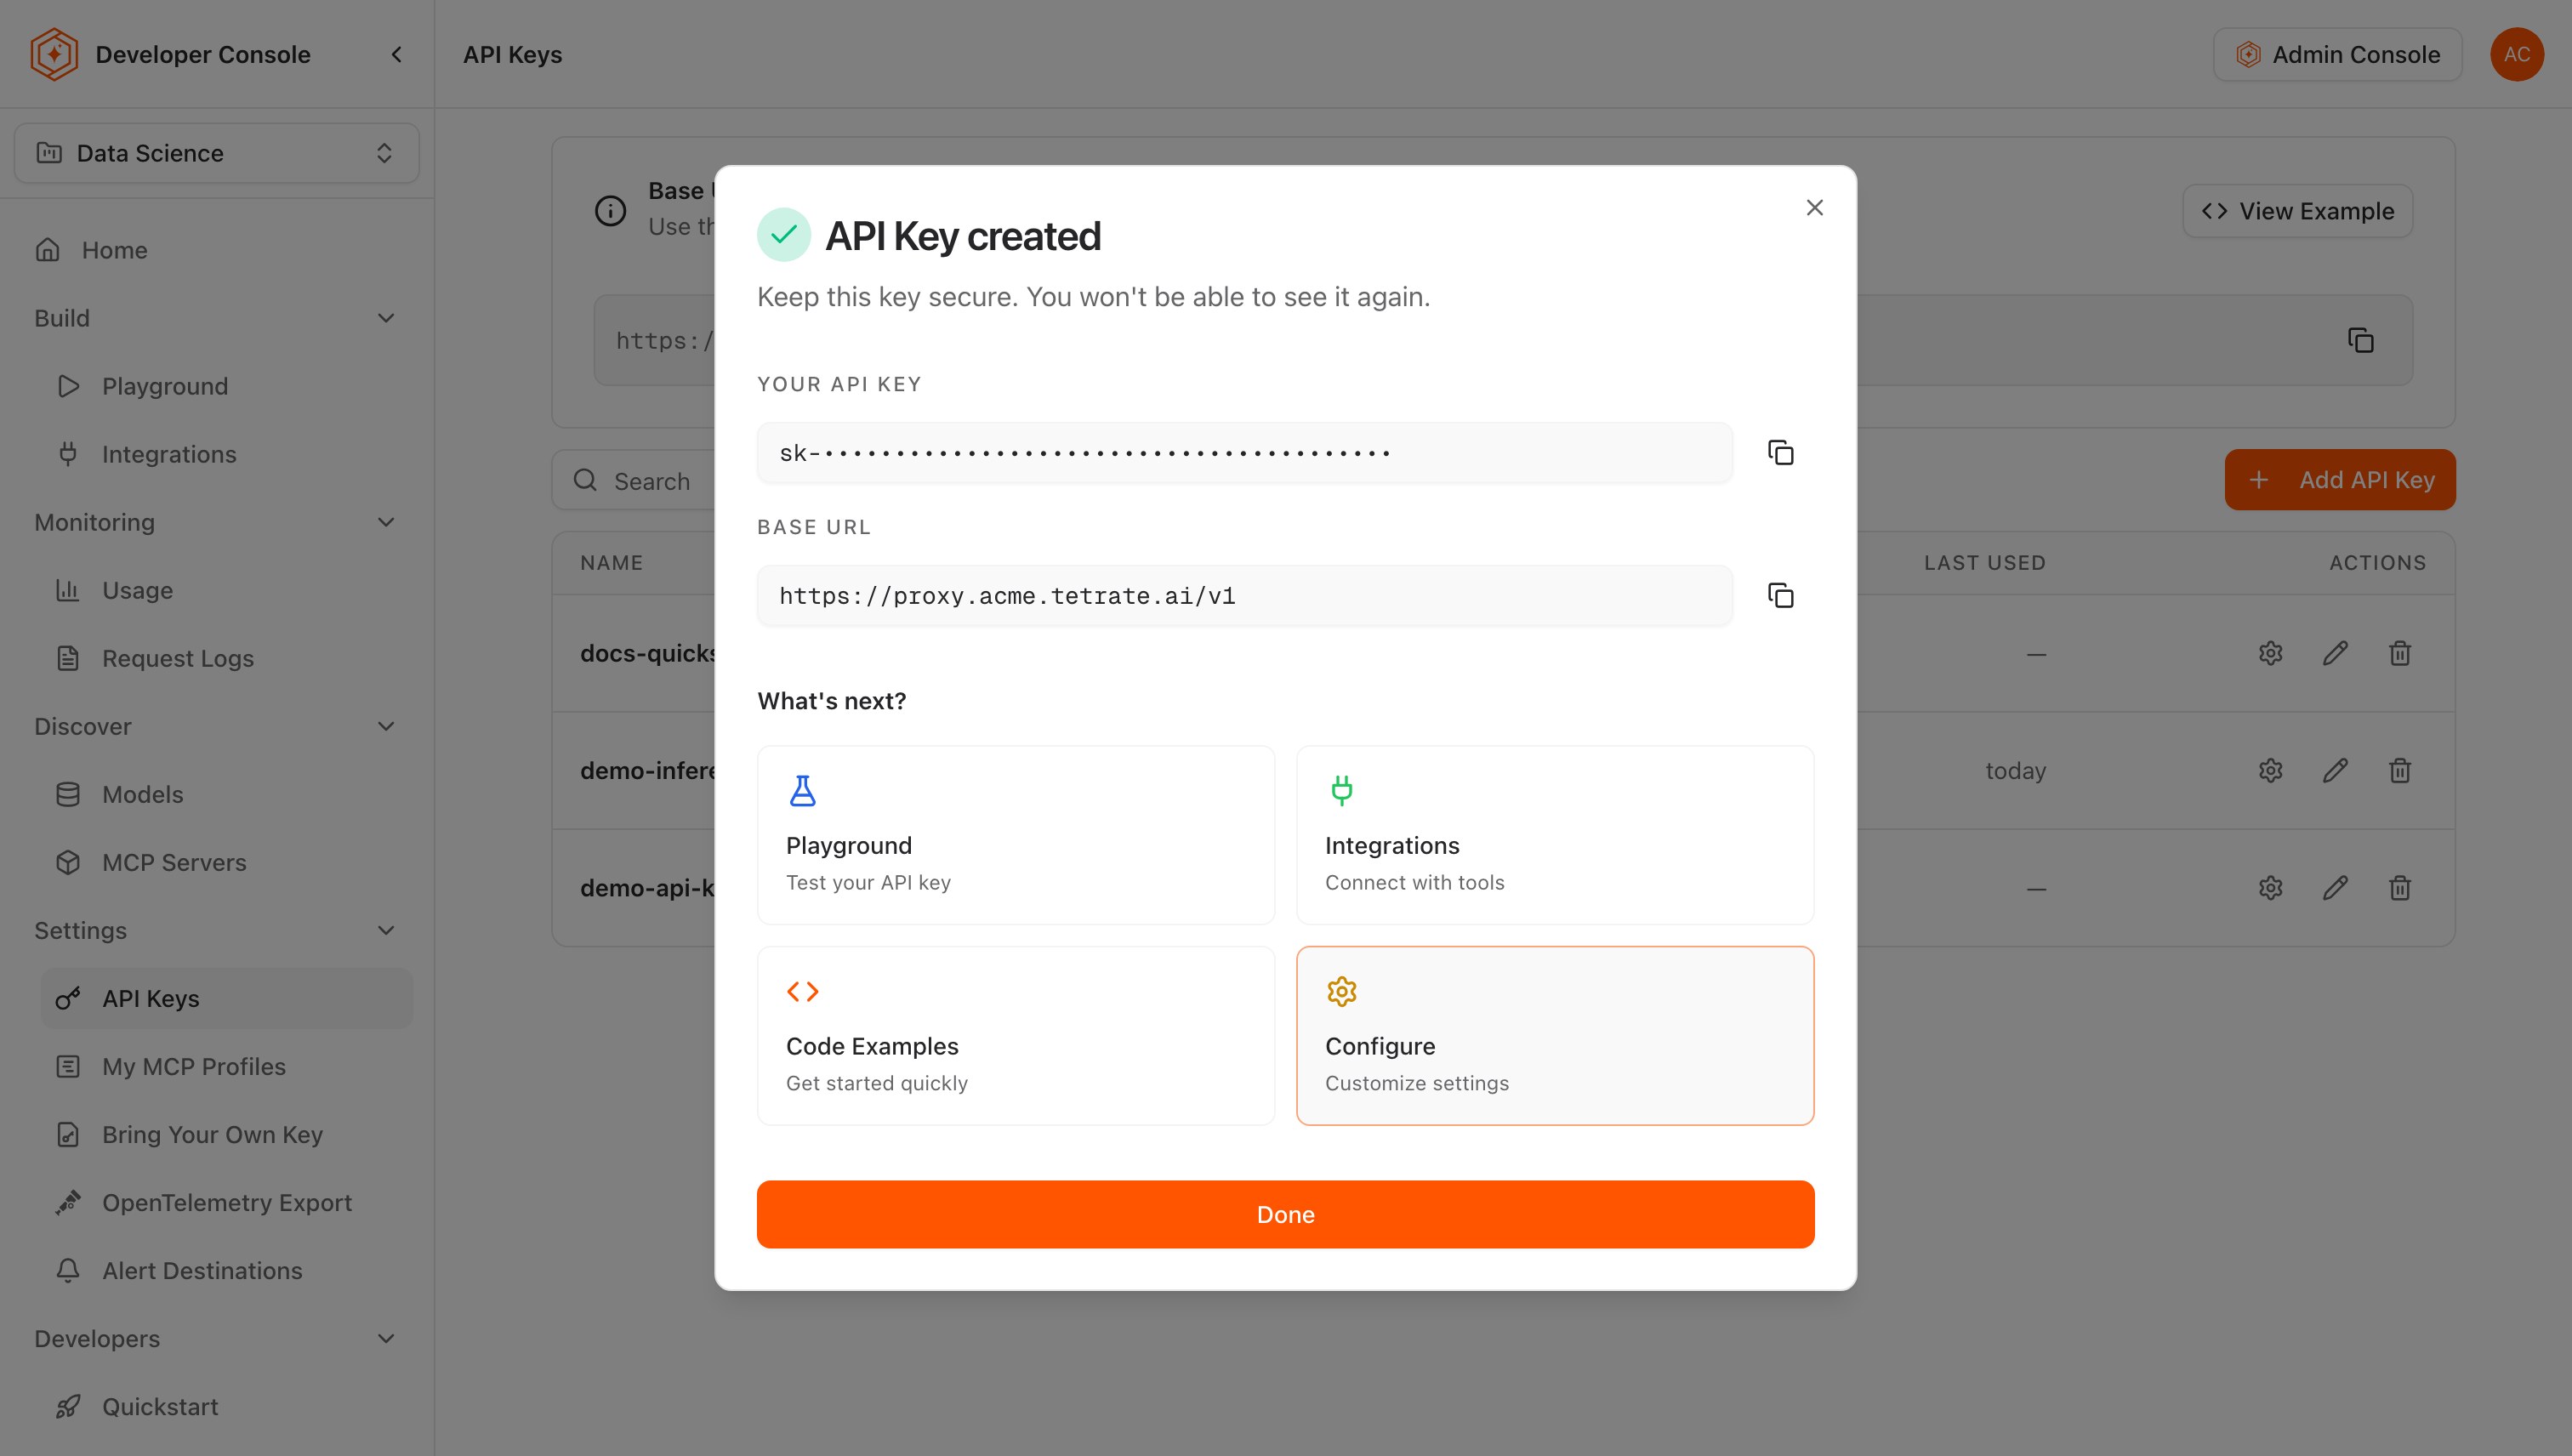
API keys grant the bearer the ability to route requests through the gateway and consume AI quota. Store the key securely (a secrets manager or environment variable); do not commit it to source control or include it in logs or error messages.
Step 3: find the proxy endpoint
The proxy endpoint URL is shown as Base URL at the top of the API Keys page, and in the dialog that confirms a new key. It typically looks like:
https://proxy.acme.tetrate.ai/v1
An application calls this address instead of calling AI providers directly. When a request arrives at the proxy, the gateway:
- Authenticates the request using the API key.
- Applies the key's own fallback and traffic-splitting policies.
- Translates the request format if routing to a different provider (for example OpenAI format to an Anthropic backend).
- Returns the normalized response, including error normalization if the upstream provider returns an error.
On Agent Router Enterprise, a project can be served from more than one address. The Console lists every endpoint the project is served from, and one key works on all of them. The API Keys page prints one of them as the Base URL: the address a project owner starred, or the project endpoint URL an administrator set. Where the Console shows no proxy endpoint, no code samples, and a notice that nothing is callable yet, no data plane serves the project. A platform administrator has to label a data plane with the project before any request can succeed.
Append the appropriate path for the intended API format:
| Format | Path | Description |
|---|---|---|
| OpenAI Chat Completions | /v1/chat/completions | Most widely supported format; compatible with all OpenAI-compatible SDKs and agent frameworks |
| OpenAI Responses | /v1/responses | Newer OpenAI Responses API with a simplified interface |
| Anthropic Messages | /v1/messages | Anthropic native format for Claude models |
For detailed examples of each format including streaming, see Gateway APIs.
Step 4: make the first request
Replace YOUR_API_KEY with the key created in Step 2, and MODEL_ID with a model the key can call. List those models first; each entry's id is a valid MODEL_ID. See Models API.
curl https://proxy.acme.tetrate.ai/v1/models \
  -H "Authorization: Bearer YOUR_API_KEY"
The only difference between calling the gateway and calling a provider directly is the base_url (or the curl URL). All other parameters, response formats, and SDK behaviors are identical.
Asking for a model the project has not been granted returns 404, even if an administrator enabled that model organization-wide. GET /v1/models lists what the key can actually call, so check there rather than against the organization catalog. See Create a project and grant models.
Using curl
curl https://proxy.acme.tetrate.ai/v1/chat/completions \
  -H "Authorization: Bearer YOUR_API_KEY" \
  -H "Content-Type: application/json" \
  -d '{
    "model": "MODEL_ID",
    "messages": [{"role": "user", "content": "Hello, world!"}]
  }'
Using Python
from openai import OpenAI

client = OpenAI(
    base_url="https://proxy.acme.tetrate.ai/v1",
    api_key="YOUR_API_KEY"
)

response = client.chat.completions.create(
    model="MODEL_ID",
    messages=[{"role": "user", "content": "Hello, world!"}]
)

print(response.choices[0].message.content)
Streaming with curl
curl https://proxy.acme.tetrate.ai/v1/chat/completions \
  -H "Authorization: Bearer YOUR_API_KEY" \
  -H "Content-Type: application/json" \
  -d '{
    "model": "MODEL_ID",
    "messages": [{"role": "user", "content": "Hello, world!"}],
    "stream": true
  }'
Streaming with Python
from openai import OpenAI

client = OpenAI(
    base_url="https://proxy.acme.tetrate.ai/v1",
    api_key="YOUR_API_KEY"
)

stream = client.chat.completions.create(
    model="MODEL_ID",
    messages=[{"role": "user", "content": "Hello, world!"}],
    stream=True
)

for chunk in stream:
    content = chunk.choices[0].delta.content
    if content:
        print(content, end="", flush=True)
Using the Playground
The Playground tests model routing interactively without code, for evaluating models or verifying routing behavior before integrating into an application.
- In the sidebar, go to Build → Playground.
- Select the API key created in Step 2 from the key picker at the top of the page. The Playground sends its requests with that key.
- Keep the Chat tab and select a model. The picker offers the models the selected key can reach, which can be fewer than the administrator enabled for the organization.
- Type a message and send it.
- View the response alongside token usage, latency, and the upstream provider that served the request.
Step 5: check the request logs
Every request the gateway processes is recorded in Request Logs. This is the primary tool for debugging, auditing, and analyzing cost.
- Go to Monitoring → Request Logs.
- The request appears with its timestamp, request ID, API key, endpoint, model and provider, token counts, cost, and status.
- Click any row to view its details, including which provider was selected and whether any fallback attempts were made. Prompts and completions are included only when an administrator sets Settings → Request logs in the Admin Console to Full; with Metadata only the entry carries the request's metadata without its content, and with Off no request log data reaches the management plane.
Request Logs also display the x-request-id correlation header that the gateway attaches to every response. Use this ID to locate the corresponding span in the OpenTelemetry tracing backend. See Gateway behavior for details on correlation IDs and the full debugging workflow.
Step 6: view usage analytics
Usage analytics aggregates metrics across all requests. Use it to track consumption trends, compare model costs over time, and understand traffic distribution across API keys.
- Go to Monitoring → Usage.
- Select a time range (for example Last 24 hours).
- View breakdowns by model and API key, including total tokens consumed, estimated cost, and request volume.
Evaluation checkpoint
- Signed in to the Console
- Created an API key and stored it securely
- Located the proxy endpoint URL (the Base URL on the API Keys page), or the list of endpoints serving the project
- Made a successful request via curl, Python, or the Playground
- Confirmed the request appears in Request Logs with provider, latency, and token details
- Reviewed usage analytics for the time period
Where to go next