Export telemetry to observability
Agent Router emits telemetry in open formats so an organization's existing dashboards, alerting rules, and retention policies absorb AI traffic alongside the rest of the application stack. Two complementary paths are supported. OpenTelemetry trace export sends per-request traces with rich attributes to any OTLP-compatible backend: Jaeger, Datadog, Grafana Tempo, Honeycomb, New Relic, or a self-hosted collector. Prometheus metrics are exposed on a scrape endpoint by each data plane component, to be pulled by any metrics agent or transformed into OTLP metrics by a Grafana Alloy (or similar) collector. Most production deployments use both: traces for per-request investigation, metrics for dashboards and alert rules.
Persona: Developer working in the Developer Console, in collaboration with whoever owns the organization's observability stack.
Estimated time: 20 to 30 minutes for the trace-export configuration, plus whatever time is required to confirm the traces land in the destination platform.
When this guide applies
Telemetry export is the right next step in any of these situations:
| Situation | What export adds over the in-Console surfaces |
|---|---|
| Dashboards and alerts already exist in Datadog, Grafana, Honeycomb, New Relic, or similar | The same dashboards and alerts can include AI traffic alongside the rest of the application stack |
| AI traffic needs to be correlated with downstream service behavior | Trace context flows through to the observability backend, where the join across services is trivial |
| Long-term retention beyond the in-Console window is required | Storage is whatever the observability platform already provides |
| Alerting on elevated error rates, latency spikes, or rate-limit saturation is required | Alerts are configured in the alerting platform the team already operates |
| Compliance or SIEM workflows depend on a specific log format | The OTLP and Prometheus formats integrate with the standard tooling these workflows already use |
For ad-hoc investigation by a single developer, the Console's Request Logs and Usage Analytics are still the right surfaces; export is the layer that scales beyond that. The two surfaces remain available regardless of whether export is configured.
Outcomes
By the end of this guide:
- Trace export to an OTLP-compatible backend is configured, enabled, and reporting a Connected status.
- At least one request issued through the gateway has produced a trace in the destination observability platform.
- The Prometheus scrape endpoint exposed by each data plane component is understood, even where it is not yet wired into the metrics collection stack.
- The boundary between platform-emitted telemetry and observability-platform-owned concerns (storage, alerting, retention) is clear.
Prerequisites
- A working API key with traffic flowing through it, as set up in Route Requests Across Providers.
- An OTLP-compatible observability backend. The endpoint URL, transport protocol (gRPC or HTTP), and authentication credentials must be obtained from whoever owns that backend.
- Confirmation that the backend's OTLP endpoint is reachable from the Agent Router data plane. This is a network reachability question, not a Console question; if there is doubt, the operator who installed Agent Router is the right person to ask.
Step 1: configure trace export
Trace export is configured once per Agent Router instance, from inside the Console. The configuration applies to all traffic flowing through the data plane; individual API keys do not need any further setup.
-
Sign in to the Developer Console.
-
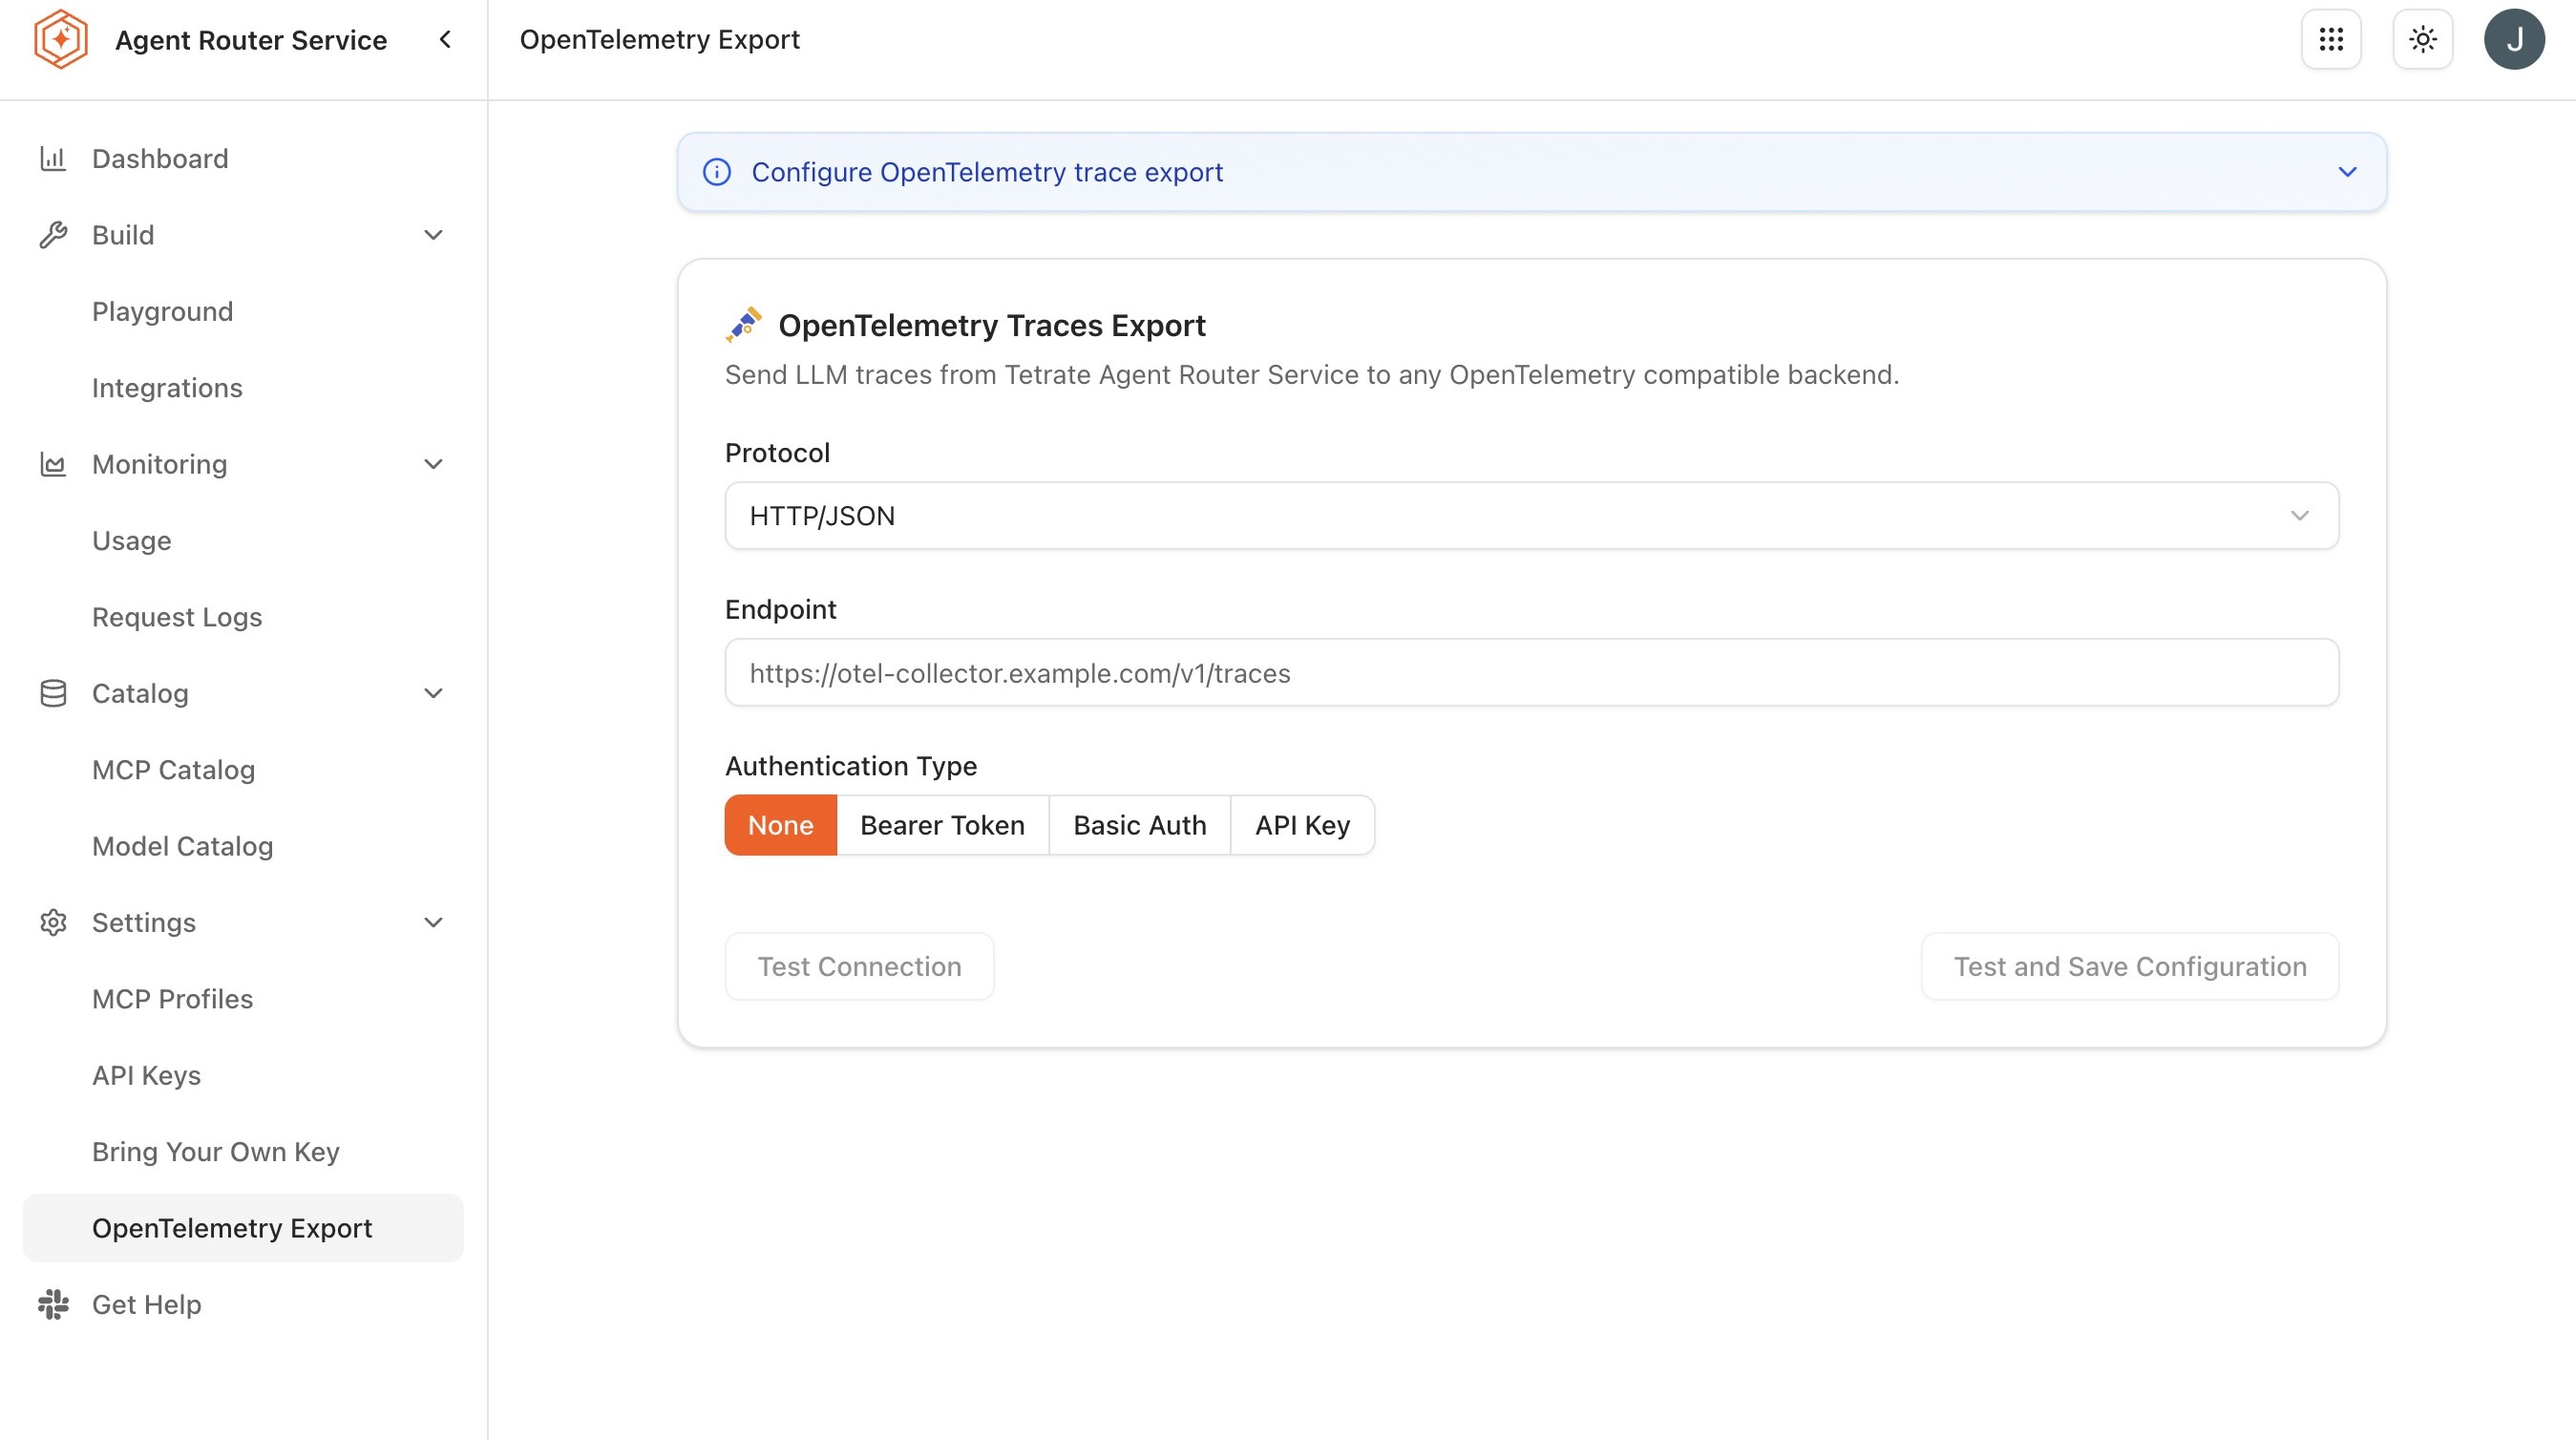
Open Settings → OpenTelemetry Export from the sidebar. The same page is reachable at
/system-integrations. -
Click Configure or Enable Export.
-
Enter the Endpoint URL of the OTLP collector. Examples by backend:
Backend Typical endpoint Default protocol Jaeger http://jaeger:4317gRPC Grafana Tempo http://tempo:4317gRPC Datadog https://trace.agent.datadoghq.comHTTP Honeycomb https://api.honeycomb.iogRPC with API key New Relic https://otlp.nr-data.net:4317gRPC with API key Self-hosted OTLP collector Collector address and port Backend-specific -
Select the transport Protocol:
- gRPC is the most common choice and is the default on port 4317.
- HTTP uses OTLP over HTTP on port 4318 and is the better choice when gRPC is blocked by intermediate infrastructure.
-
Configure Authentication. The right option depends on the backend:
Auth mode When to use it None Internal endpoints on a trusted network Bearer Token OTLP collectors that accept a static bearer token Basic Auth Backends that require username and password (rare for OTLP) API Key Hosted backends such as Honeycomb, New Relic, and Datadog. The header name is often vendor-specific and configurable here Custom Headers Backends that require one or more arbitrary headers, for example, DD-API-KEYfor Datadog -
Optionally set the Service name under which traces appear in the destination backend. Left unset, spans arrive under the data plane's own service name,
ai-gateway-extproc. A more specific value is useful in tenants that run multiple Agent Router instances (agent-router-prod,agent-router-staging) so the destination dashboards can distinguish them. -
Optionally set the Sampling rate. 100 % is appropriate for evaluation and low-volume environments; high-volume production typically samples lower.
-
Click Save.
-
Enable the export toggle.
-
Confirm the status indicator transitions to Connected.
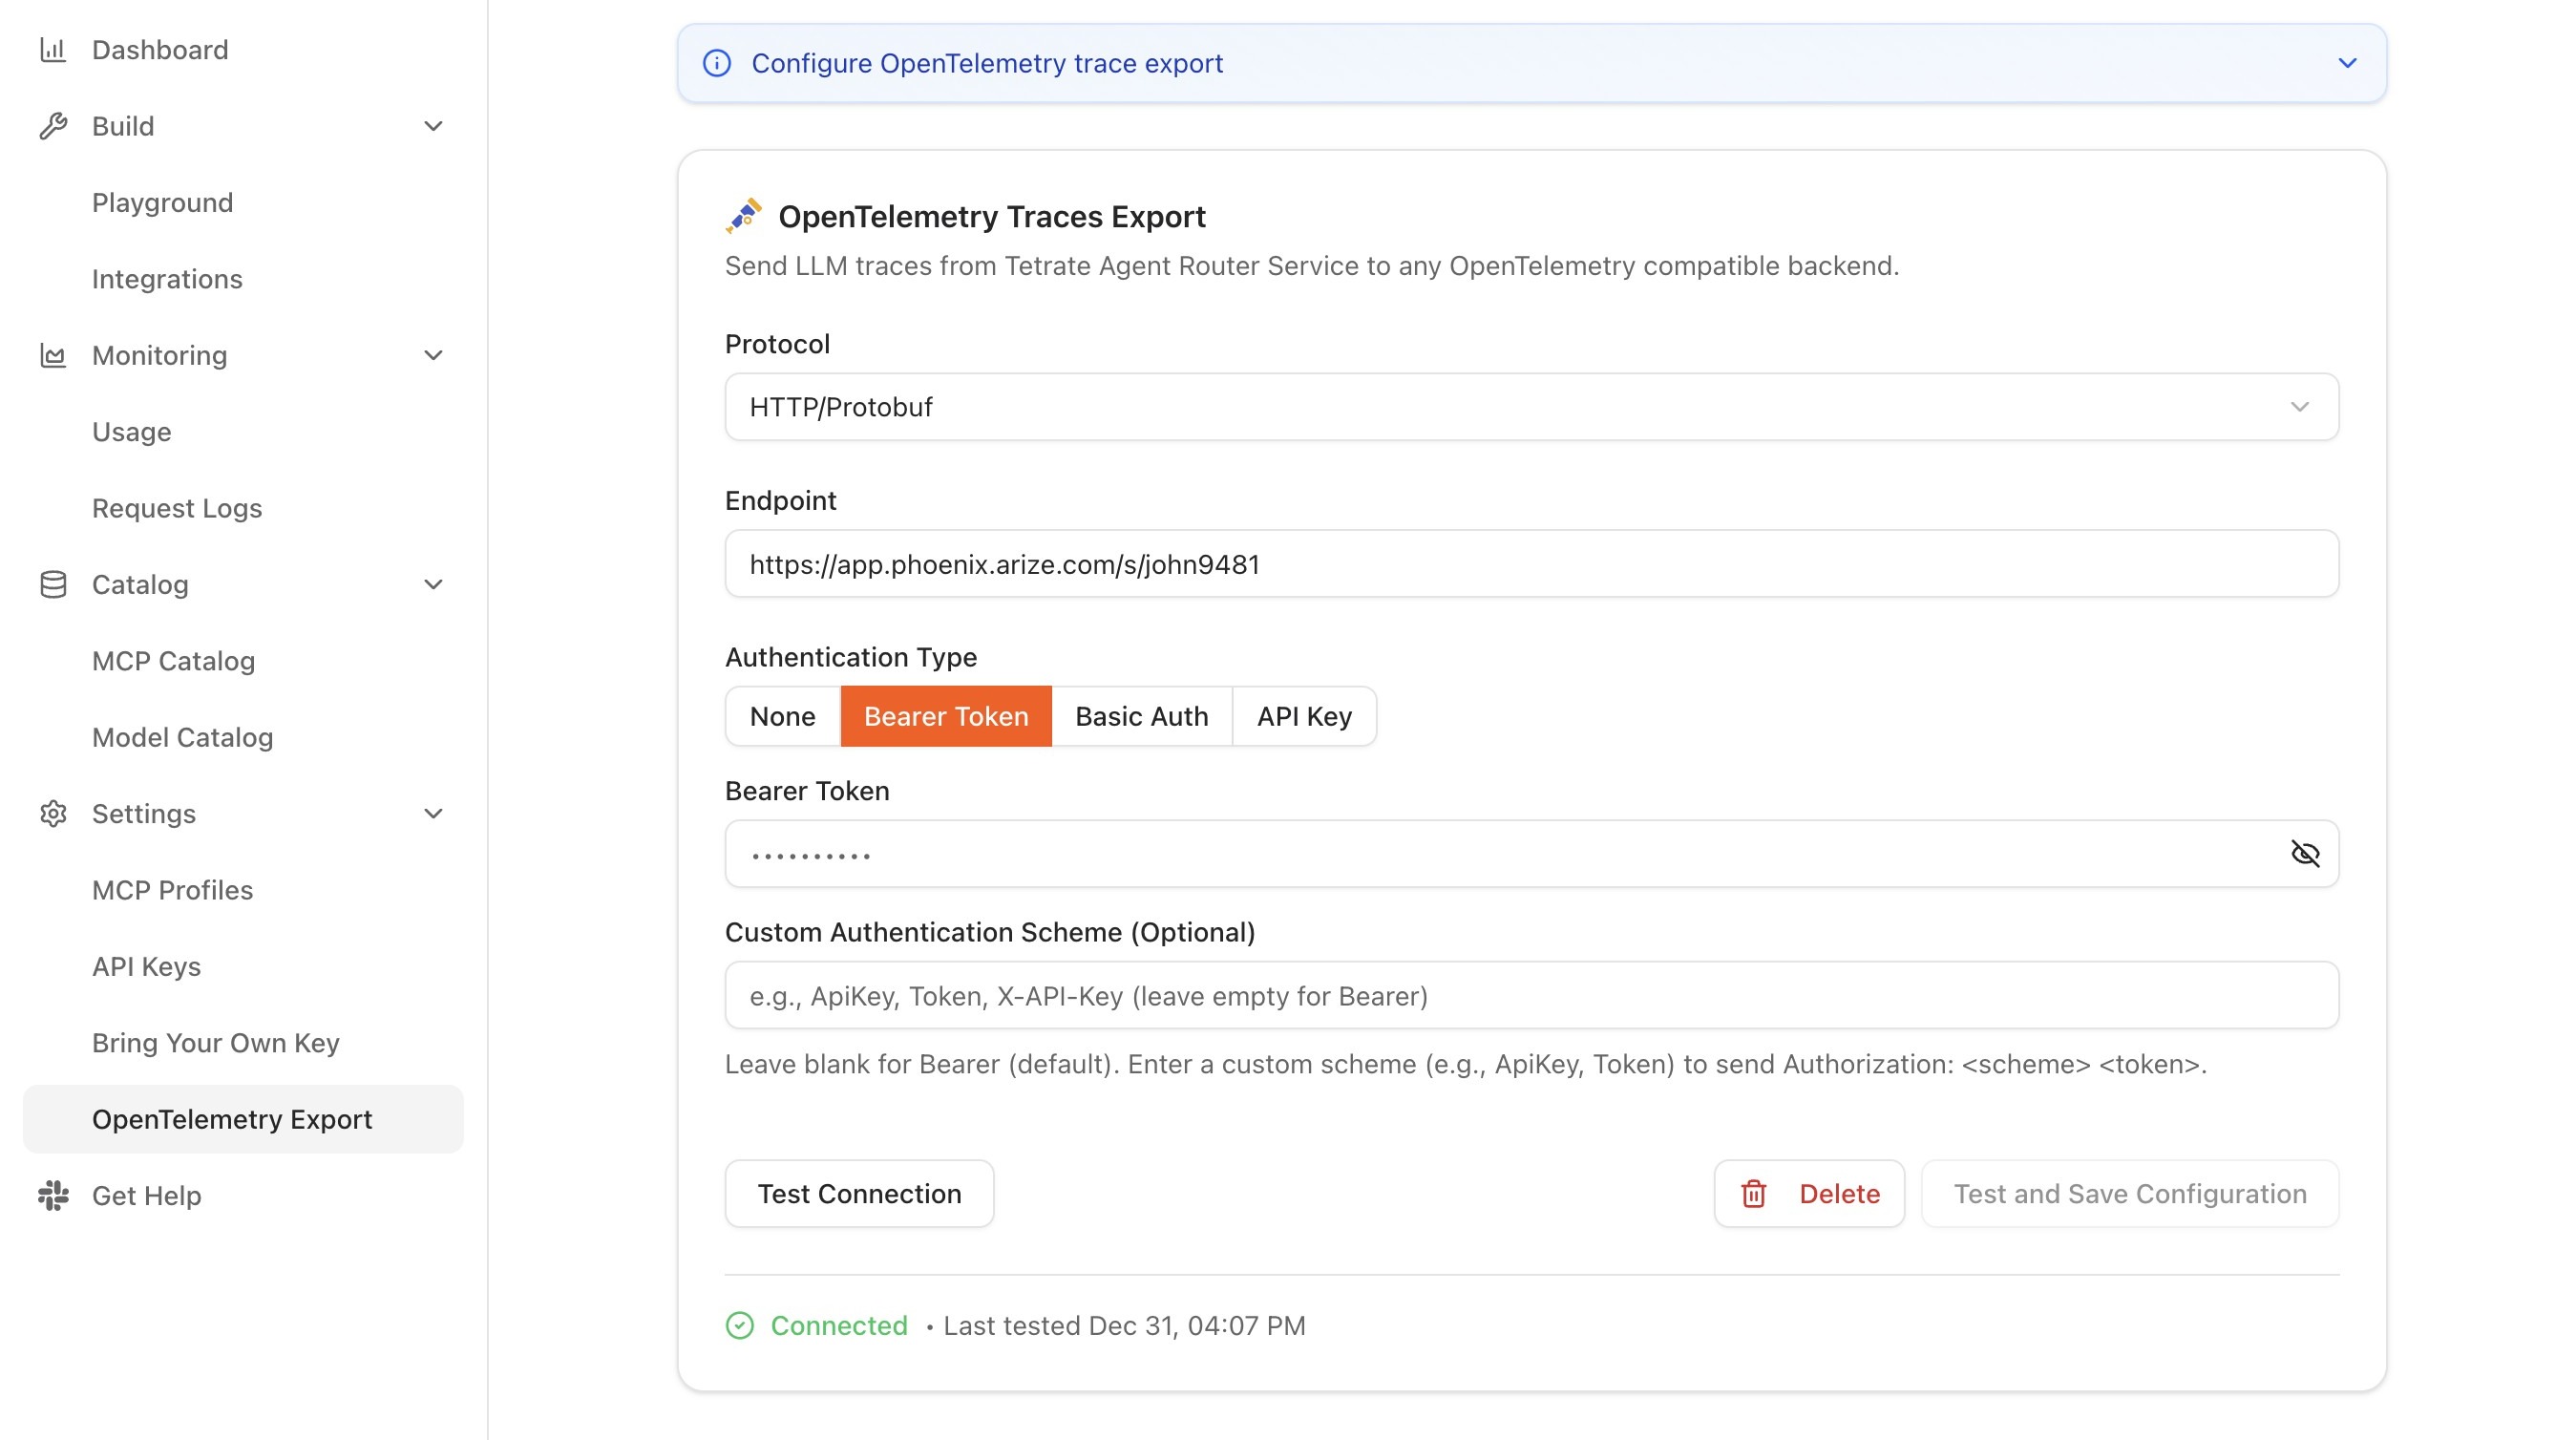
The status indicator is the most useful signal during initial setup. It reports one of three states:
| Status | Meaning |
|---|---|
| Connected | Traces are being exported successfully |
| Disconnected | Export is disabled or not yet configured |
| Error | Export is enabled but the endpoint is unreachable or returning errors |
A persistent Error state usually points to one of three issues: the endpoint is unreachable from the data plane (network or DNS), the protocol does not match the collector's expectation (gRPC vs HTTP), or the authentication credentials are wrong. Each of these is checkable independently.
The configuration can be revised at any time from the same page. Changing the endpoint URL, protocol, or authentication settings and clicking Save applies the new values immediately; no restart of the data plane is required. Toggling the export switch off stops trace export immediately while preserving the saved configuration, so export can be re-enabled later without re-entering the endpoint and credentials.
Step 2: generate traffic and inspect the destination
Once export is active, every gateway request produces a trace. A small burst of test traffic is enough to confirm the pipeline end-to-end. PROXY_URL stands for the gateway URL for the deployment with /v1 appended, the same value the Console shows as the proxy endpoint.
for i in {1..5}; do
  curl -s PROXY_URL/chat/completions \
    -H "Authorization: Bearer YOUR_API_KEY" \
    -H "Content-Type: application/json" \
    -d '{
      "model": "gpt-4o",
      "messages": [{"role": "user", "content": "Generate trace data."}]
    }' > /dev/null
done
Then, in the destination observability platform:
-
Search for traces under the service name that the data plane reports. Spans are emitted by the ai-gateway extproc, which reports
ai-gateway-extprocunless the deployment overrides it. -
Open a recent trace.
-
Confirm one span per request is present, named for the endpoint that served it. The five requests above are chat completions, so five spans named
ChatCompletionare expected.Each request produces a single flat span. There are no gateway, routing, or inference child spans, and the Envoy hop is not instrumented, so no proxy span accompanies it. Where the calling client is itself instrumented, the span attaches to the client's trace through W3C trace context rather than appearing as a trace root.
-
Confirm the expected attributes are populated on the span:
llm.model_name, the model that served the request.llm.token_count.prompt,llm.token_count.completion, andllm.token_count.total.openinference.span.kind, set toLLM.request.id, the per-request correlation ID.input.valueandoutput.value, subject to the active logging mode.
Request latency is read from the span's own duration; it is not stamped as an attribute. Failed calls carry an
exceptionevent withexception.typeandexception.messagerather than an HTTP status attribute.
The full span model, including every attribute and event and the fields that are deliberately absent, is enumerated in OpenTelemetry metrics and attributes.
If traces appear in the destination but with missing attributes, the integration is working but the receiver may be filtering or sampling on its own side; the destination platform's documentation is the right place to investigate. If traces do not appear at all and the Console status indicator is Connected, the most common cause is a service-name filter or a search range that excludes the test traffic.
OpenInference semantic conventions
On top of the OpenTelemetry (OTLP) export described above, the gateway annotates LLM spans with OpenInference semantic conventions, the open standard for large-language-model telemetry attributes. Base OTLP defines how a span is structured and transported, but it says nothing about what an LLM call means. OpenInference fills that gap with a shared vocabulary for model, token, and prompt/response attributes, so that LLM-aware observability tools can interpret the spans without custom parsing.
What this convention adds beyond base OTLP is a set of LLM-specific span attributes, including:
- The span kind (
openinference.span.kind), which marks the span as an LLM, embedding, or reranker operation. - The model name and the invocation parameters supplied with the request.
- Prompt and completion token counts captured per span, including cache-read, cache-write, and reasoning subtotals where the provider reports them.
- The input and output of the call, captured per span subject to the active logging mode; prompt and response content appears only when the logging mode permits it. Token counts are treated as metadata and are recorded regardless. See Configure request logs for how the logging mode governs whether request and response bodies are recorded.
Because these attributes follow a published standard rather than an Agent Router-specific schema, traces become meaningful in any tool that understands the convention; model, token, and prompt/response fields are recognized and rendered without bespoke mapping. The exact attribute set is enumerated in the reference; see OpenTelemetry metrics and attributes for the full list.
Step 3: add Prometheus metrics to the pipeline
Each data plane component exposes a Prometheus-compatible metrics endpoint, which is the second integration path. This is independent of trace export; metrics can be enabled regardless of whether traces are being exported, and the two together give a substantially fuller picture than either alone.
Agent Router does not include a metrics collector itself. Instead, an existing metrics agent (Prometheus, a Grafana Alloy collector, the Datadog agent in OpenMetrics mode, or any other scraper) pulls metrics from Agent Router's scrape endpoints and forwards them to whichever destination the observability stack uses. A reference Grafana Alloy configuration is supplied that scrapes the data plane components and forwards the metrics as OTLP to a downstream collector; it is a useful starting point even for teams that ultimately route metrics through a different agent.
Two consequences of this design are worth noting:
- The scrape endpoint is internal to the data plane and is reachable from inside the same Kubernetes cluster. Exposing it outside the cluster is a deployment decision rather than a Console one.
- Metrics and traces share enough dimensions to be joined in the destination platform. The model is the most reliable join key, appearing as
llm.model_nameon spans and as a model label on metrics. Where per-request correlation is needed, therequest.idspan attribute is the right handle, since it is the same correlation ID carried by Request Logs.
Alerting and storage: where each one belongs
Two operational concerns are deliberately delegated to the observability platform rather than handled inside Agent Router.
Alerting
Agent Router emits metrics with the dimensions an alerting rule needs (error rate, latency, rate-limit indicators, model, provider, and key) but it does not drive alerts itself. Alerting rules live in the observability platform, where they can be combined with rules covering the rest of the application stack, escalated through the same paging chains, and tuned with the same noise-reduction tooling. Suppressing alerts for invalid payloads, expected policy denials, or scheduled maintenance windows happens in the alerting platform's rule engine rather than in the gateway.
The benefit of this split is that an organization that already has a mature alerting setup does not have to maintain a second, vendor-specific one inside Agent Router. The cost is that a fresh deployment that does not yet have such a setup will need one before alerting on AI traffic is feasible.
Storage
For trace data, the destination observability platform owns retention, indexing, and query performance. For in-Console request logs, Tetrate manages the underlying storage infrastructure on the management plane (capacity, index health, and query performance) so there is no storage management burden on the customer side.
The implication is that the in-Console surfaces are the right place for "last 90 days" investigations, while the exported telemetry is the right place for longer-horizon retention, compliance archiving, and SIEM workflows.
Where to go next
Monitor traffic and usage
The in-Console request log and usage surfaces that complement exported telemetry.
Govern MCP server access
The operator-side companion for controlling what MCP traffic Agent Router exposes.
Audit Agent Router activity
The operator equivalent of the monitoring surfaces covered in this and the previous guide.