Audit platform activity
Two questions land on a platform operator's desk more reliably than any other: who did this?, usually after a configuration changes unexpectedly, a key disappears, or a model behaves differently than it did yesterday; and what is the platform actually doing?, usually before a quarterly review, a cost forecast, or a compliance attestation. Both are answered from the same place: the platform's record of activity, surfaced through two complementary screens in the Admin Dashboard. Audit Logs is the immutable per-event record of every administrative action, and Usage Analytics is the aggregated traffic view. This guide covers both, the investigation patterns that combine them, and the compliance posture the audit surface supports.
Audit Logs is the per-event record. Every administrative action (model enablement, provider configuration change, user role change, API key revocation, SSO setting modification, or announcement lifecycle event) is captured with a timestamp, an actor, the resource affected, and a structured diff of what changed. The log is immutable; nothing in the platform can edit or delete an entry once it has been written. Usage Analytics is the aggregated traffic view: platform-wide request counts, token totals, costs, and breakdowns by user, model, provider, and API key, with time-range filtering and export. Together they answer the two questions: Audit Logs for "who did what", Usage Analytics for "what is happening".
Persona: Platform operator working in the Admin Dashboard, often under time pressure during an incident or a compliance review.
Estimated time: 10--15 minutes for an initial tour; ongoing thereafter.
When this guide applies
This guide is the right surface in any of these situations:
| Situation | Surface that helps most |
|---|---|
| Investigating a configuration that has changed unexpectedly | Audit Logs, filtered by resource and time range |
| Identifying who revoked an API key, or when | Audit Logs, filtered by action type |
| Producing a SOC 2, ISO 27001, or other compliance attestation | Audit Logs export, filtered by the relevant time window |
| Forecasting cost across the rest of the quarter | Usage Analytics with a long time range |
| Identifying the heaviest-consuming user or team | Usage Analytics with the By User breakdown |
| Detecting an unexpected spike in spend | Usage Analytics with anomaly inspection, then Audit Logs to correlate to a recent change |
For the developer-side equivalents of the same data (per-request investigation and per-key usage), the Monitor Traffic and Usage developer guide is the corresponding surface.
Outcomes
By the end of this guide:
- The Audit Logs surface has been opened, exercised, and at least one audit entry has been located with the filters.
- The Usage Analytics surface has been opened and the user, model, provider, and API key breakdowns reviewed.
- A combined investigation pattern ("use Usage Analytics to spot the anomaly, then Audit Logs to find the cause") has been walked through at least once.
- The compliance and retention model is understood, including the immutability guarantee on the log.
Prerequisites
- Administrator access to the Admin Dashboard, typically the
super_adminorbilling_adminrole for Usage Analytics, andsuper_adminfor the full Audit Logs surface. - Some recent activity on the platform. A freshly-installed platform with no traffic and no administrative changes will surface empty screens that are technically working but uninformative.
Step 1: open audit logs and orient
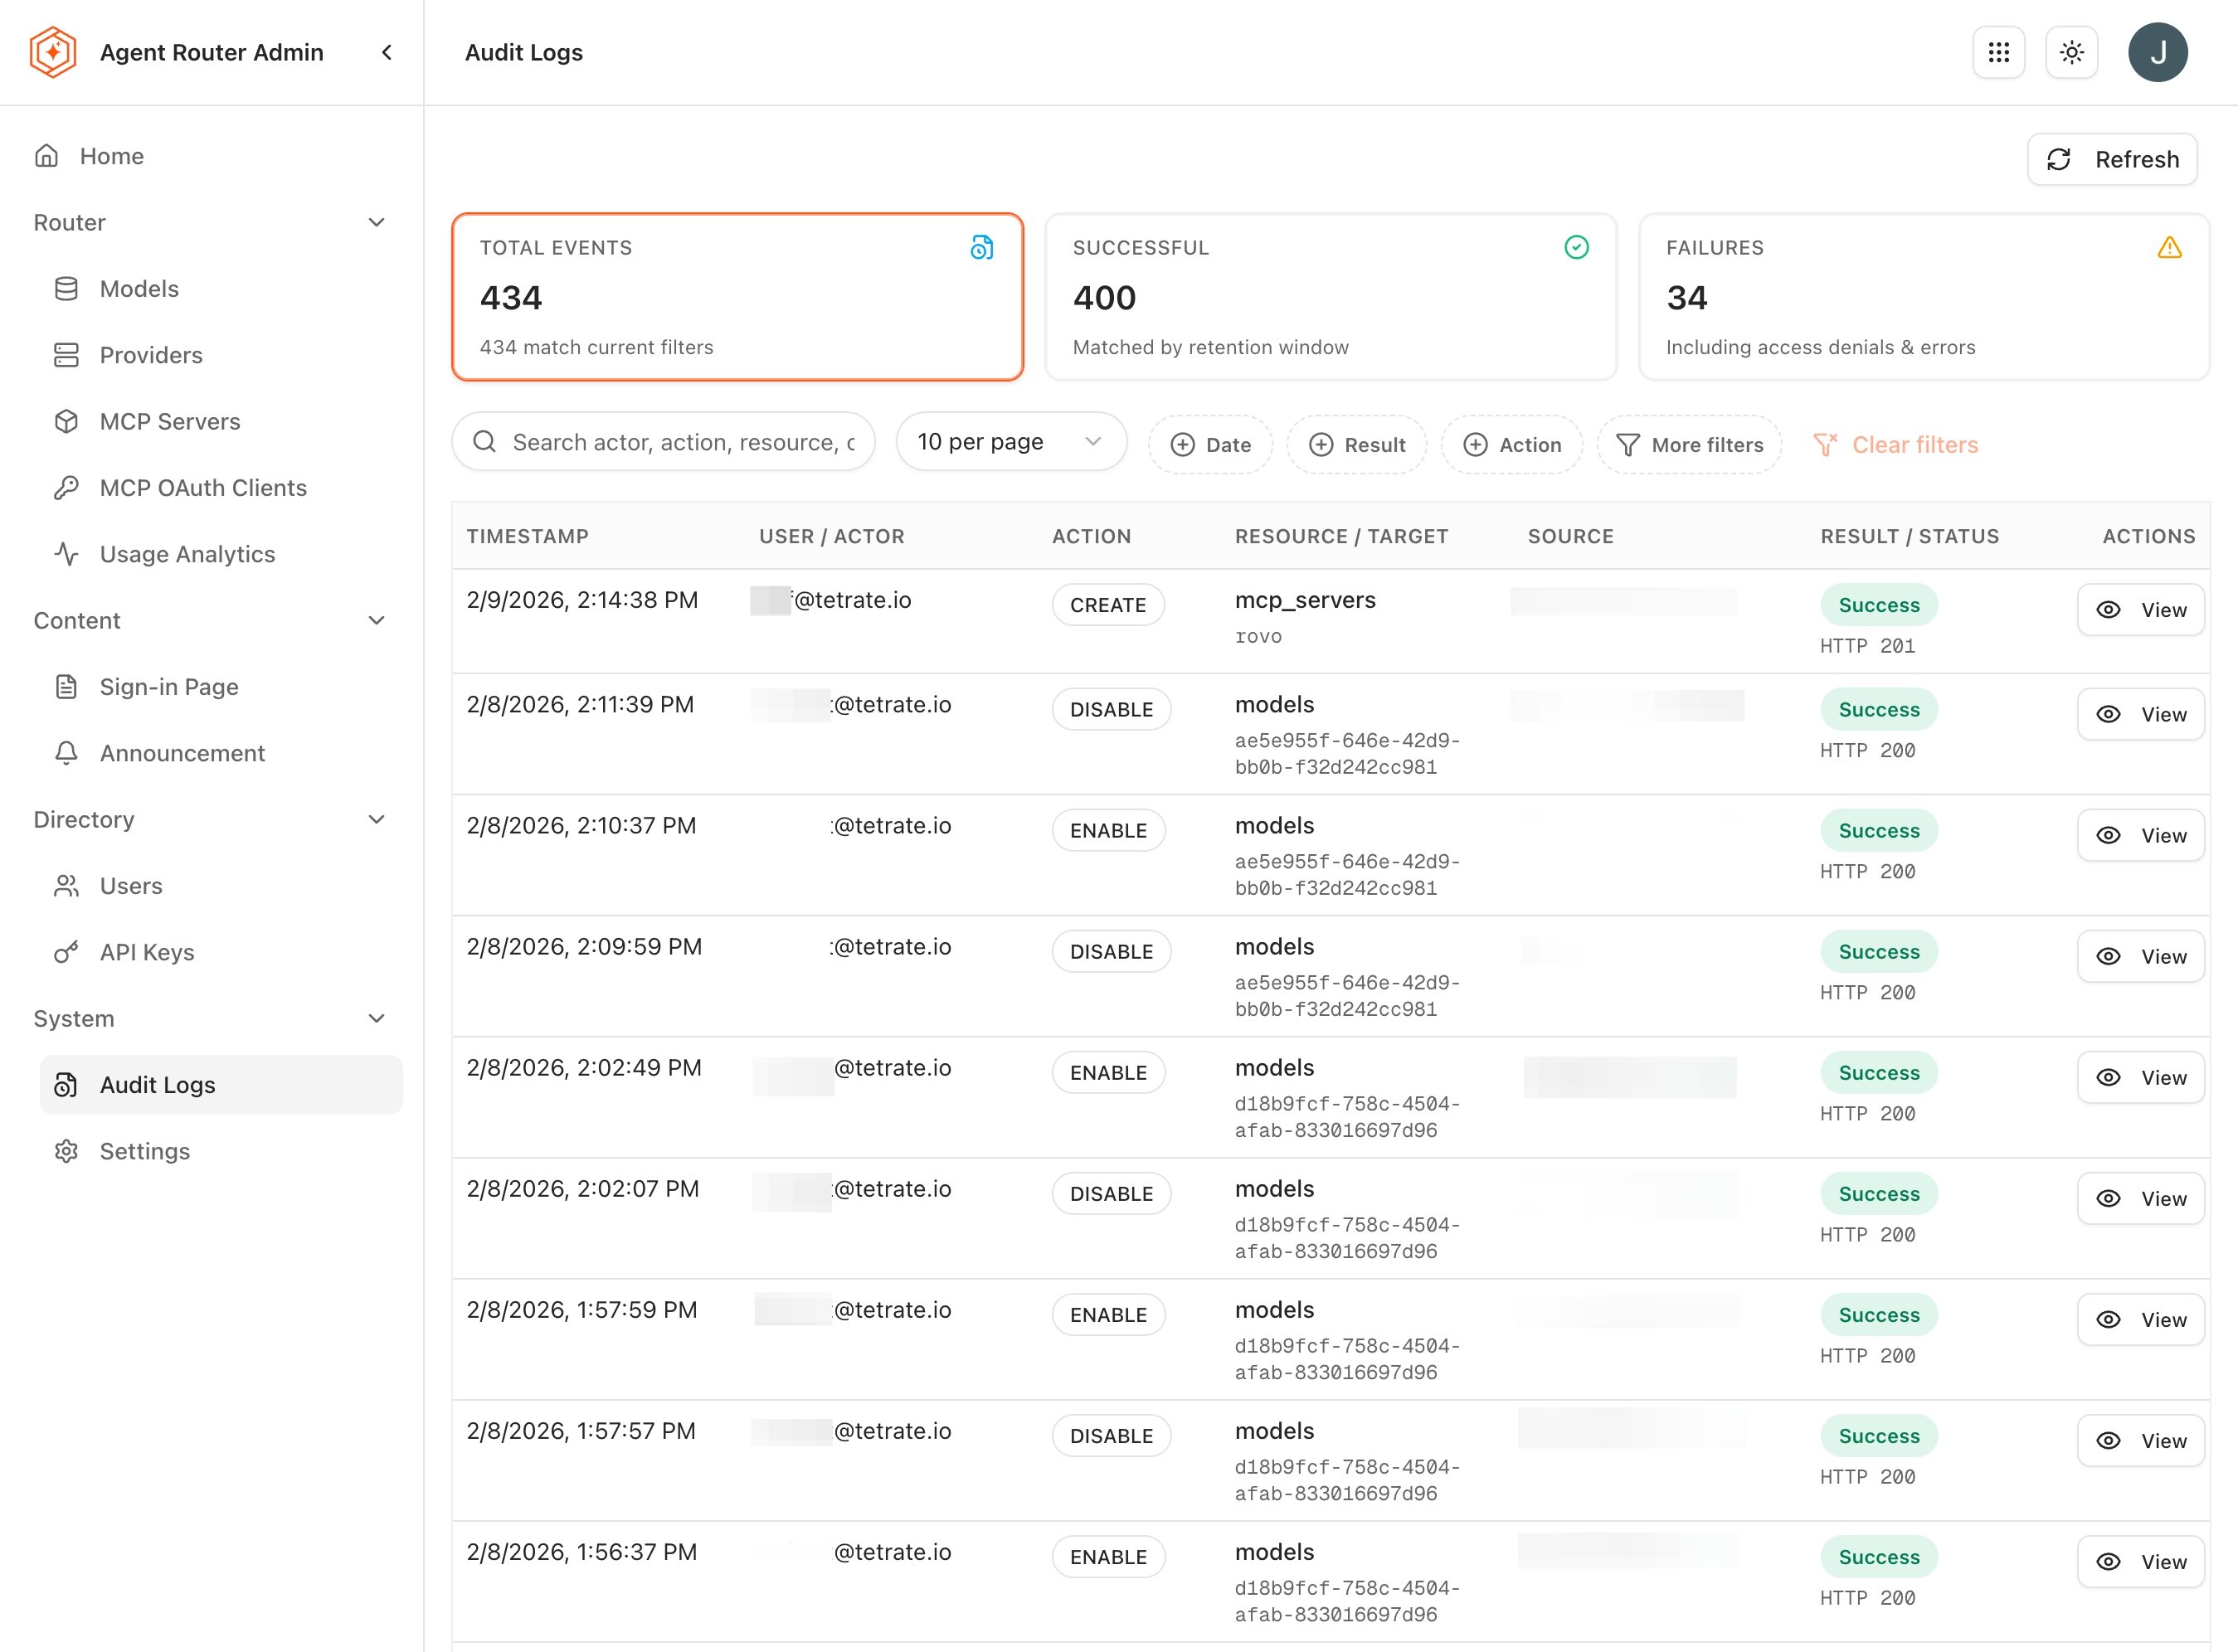
The Audit Logs surface is the closest the platform comes to a single source of truth for what has been changed and by whom. Every administrative action surfaces here, with no editing or deletion possible after the fact.
- Sign in to the Admin Dashboard.
- Open Audit Logs from the sidebar.
-
Review the columns surfaced for each entry:
Field What it carries Timestamp Exact date and time in UTC Actor The user who performed the action Action A structured event type such as model.enabled,user.role_changed,api_key.revokedResource The resource the action affected: a model name, a user email, or an API key name Details Additional context, including old and new values where applicable -
Note that entries appear in reverse chronological order. The most recent action is at the top of the list.
The action vocabulary is intentionally regular. Each action follows a <resource>.<verb> shape, which makes filters predictable and consistent across the platform. Common action types:
| Action type | Generated when |
|---|---|
model.enabled / model.disabled | A model's availability is toggled in Models Management |
provider.created / provider.updated / provider.deleted | A provider configuration changes in Providers Management |
user.role_changed | A user's role is modified in Users |
api_key.revoked | An API key is revoked, either from the Console or from the Admin Dashboard |
announcement.created / announcement.archived | Announcements are created or retired |
sso.configured / sso.enabled / sso.disabled | SSO configuration changes |
mcp_server.created / mcp_server.updated / mcp_server.deleted | MCP catalogue changes |
mcp_oauth_client.* | OAuth client lifecycle events |
Step 2: investigate a specific change
Most investigations into the Audit Logs surface come down to a sequence of filter applications. The available filters can be combined; the more specific the combination, the smaller and more useful the result set.
- Set the time range to the window around the moment of interest. A narrower window is almost always more useful than a wider one.
- Apply the Actor filter to a specific user if there is reason to suspect a particular operator's actions.
- Apply the Action filter if the type of change is known, for example,
provider.updatedif a provider is the suspected cause. - Apply the Resource filter to a specific resource if the affected object is known: a model identifier, a user email, or an API key name.
- Inspect the Details column on the resulting entries. The diff between old and new values is usually enough to identify what changed.
A worked example. A developer reports that requests targeting gpt-4o started failing yesterday afternoon. To investigate:
- Set the time range to yesterday afternoon, plus a couple of hours of buffer on either side.
- Set the resource filter to
gpt-4o. - Review the resulting entries. A
model.disabledaction ongpt-4owould explain the symptom immediately. - If no model-level change shows up, broaden the search by removing the resource filter and looking for
provider.updatedorprovider.deletedevents on the OpenAI provider in the same window.
The same pattern applies to almost every "what changed" investigation: narrow on time first, then on resource or action, then read the details.
Step 3: open usage analytics and orient
Where Audit Logs answers "what changed", Usage Analytics answers "what happened". The two are designed to be used together, and they share the same time-range model.
- Open Usage Analytics from the sidebar.
-
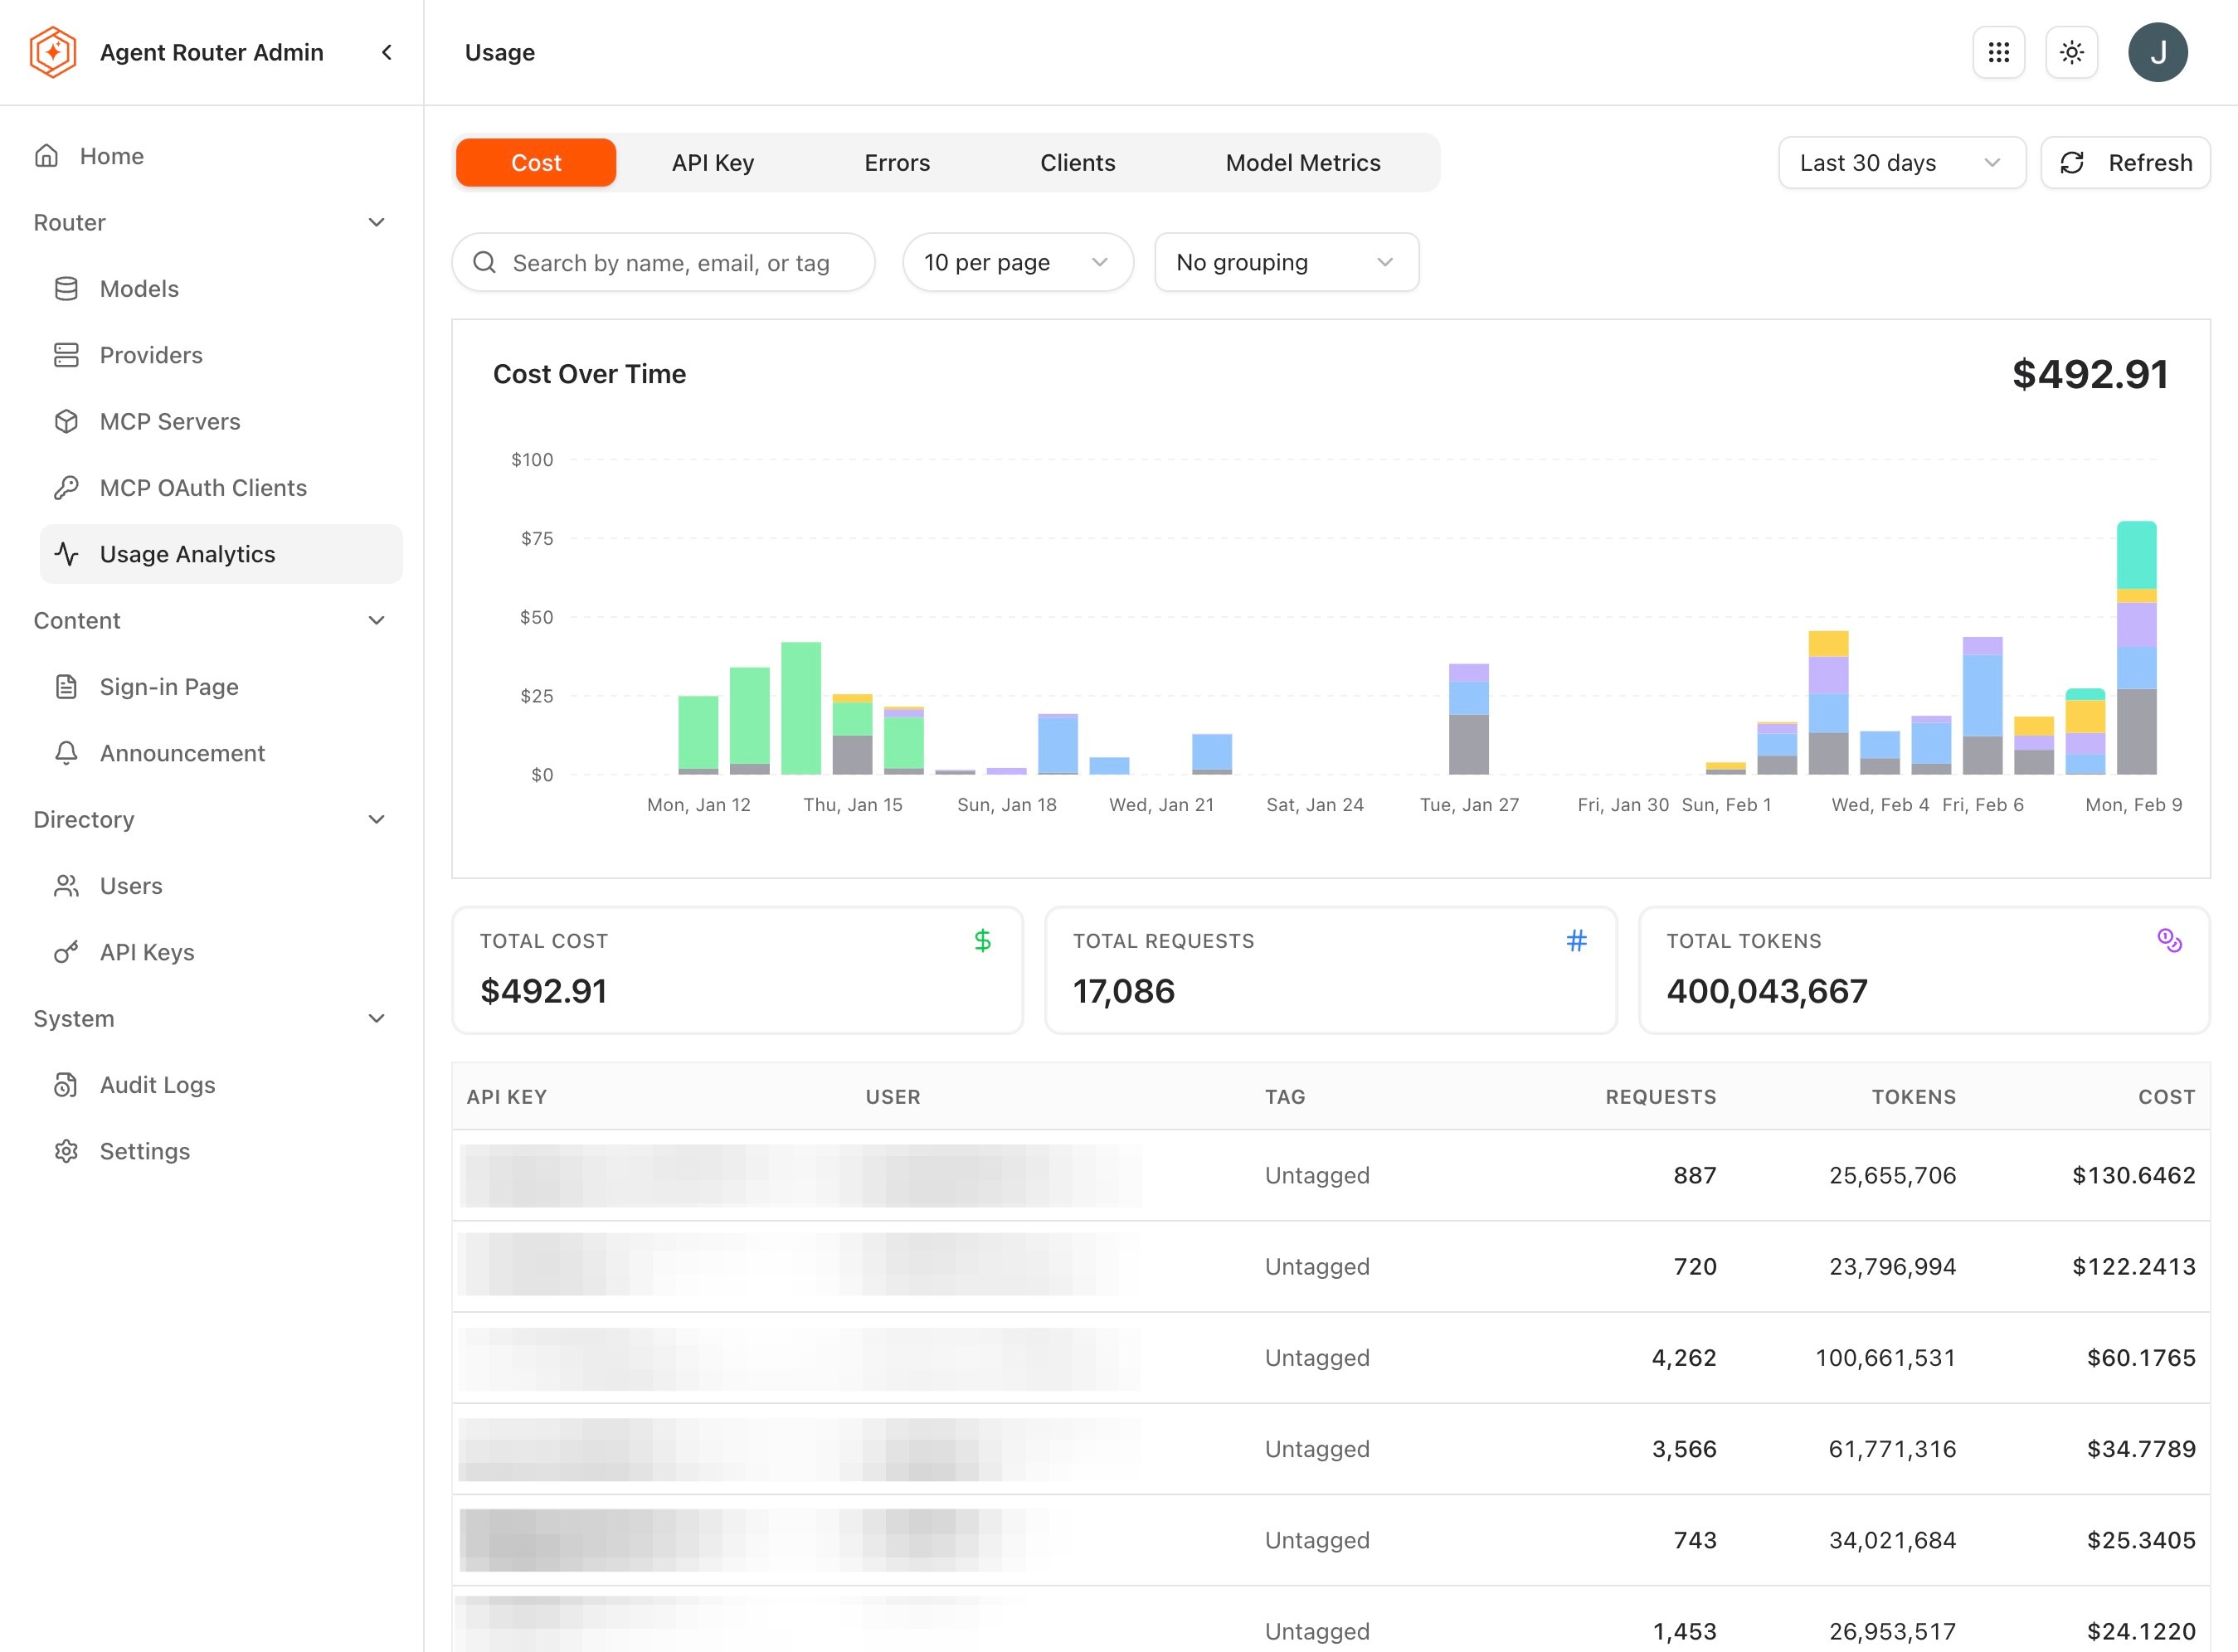
Review the top-level metrics:
Metric What it captures Total Requests All API requests in the selected time range Total Tokens Combined input and output token totals Total Cost Estimated cost from model pricing tiers and token totals Unique Users Number of distinct users who issued requests Unique Models Number of distinct models that received requests -
Apply a time range at the top of the page. Presets cover last 24 hours, last 7 days, and last 30 days; a custom range covers anything longer or more specific.
-
Switch between the available breakdowns:
Breakdown What it reveals By User Ranked list of users by requests, tokens, or cost; useful for identifying heavy consumers or unusual patterns By Model Which models the workload actually leans on; useful for retiring rarely-used models and for negotiating with providers By Provider Cost and volume across providers; useful for contract negotiation and capacity planning By API Key Per-key request and cost picture; useful for spotting integrations that might need rate limiting
The By User breakdown supports drill-down. Selecting a user row opens that user's individual usage details, which is the fastest way to move from "this user is an outlier" to the specific requests, models, and costs behind the outlier.
The distinction between this surface and the developer-side Usage page in the Console is worth keeping clear:
| Feature | Admin Usage Analytics | Console Usage |
|---|---|---|
| Scope | All users and API keys | The signed-in user's own data |
| Breakdowns | User, model, provider, API key | Model, API key |
| Cost analysis | Platform-wide cost totals and per-user costs | Individual user costs |
| Export | Full platform data export | Personal data export |
| Audience | Platform administrators | Individual developers |
Step 4: combine the two surfaces in an investigation
The interesting investigations almost always cross both surfaces. The pattern that works most reliably:
- Spot the anomaly on Usage Analytics. An unexpected cost spike on the cost-by-provider chart, an unfamiliar model in the by-model breakdown, an outlier in the by-user list.
- Identify the resource. Filter Usage Analytics down to the specific user, model, provider, or key the anomaly points at.
- Switch to Audit Logs. Apply the same time window plus the resource filter.
- Look for an administrative event. Most surprising traffic patterns are explained by a recent configuration change: a new model enabled, a routing change, a user role modified, or an API key reissued.
- Reconstruct the timeline. The combination of the audit entry and the usage chart shows what changed, who changed it, and the resulting traffic shift.
The reverse direction (starting from an audit event and looking for its traffic consequences) is equally common. A recent provider.created event makes a new provider show up in the by-provider breakdown; a recent model.enabled makes a model appear in the by-model breakdown; these correlations are how the "did the change have the intended effect" question gets answered.
Step 5: export for compliance and reporting
Usage Analytics supports export of the filtered data:
- Apply the time range and breakdown filters that match the report being produced.
- Click Export.
- Select the format (typically CSV).
- The downloaded file contains the metrics for the selected filters and time range.
Audit Logs export, where supported by the deployment, follows the same shape. The exported records are the same immutable rows that the screen displays, with all of the audit fields included.
Compliance posture
The audit surface is deliberately built to satisfy the audit and integrity requirements of SOC 2, ISO 27001, and similar frameworks. Three properties are worth being able to assert:
- Immutability. Audit entries cannot be edited or deleted by any user, regardless of role. There is no "delete from the log" operation anywhere in the Admin Dashboard.
- Coverage. Every state-modifying administrative action generates an entry. There is no path through the Admin Dashboard that changes platform state without leaving a record.
- Retention. The retention period for audit data is set by the deployment configuration. Long-horizon retention, including compliance-archival use cases, is supported through export to an external system; the in-platform window is intended for active investigation rather than indefinite storage.
What to do next
- Configure single sign-on: the SSO and role-mapping surface generates audit events that this guide makes visible. See Configure Single Sign-On.
- Working with budgets: budgets are enforced inline and visible in Usage Analytics. See Working with Budgets.
- Run multiple platform instances: multi-instance deployments need to be audited per instance; the audit surface helps confirm that boundary. See Run Multiple Platform Instances.
The audit and usage surfaces remain available across every subsequent operational activity.
Where to go next