Data flows
Tetrate Agent Router moves three different kinds of data, and each kind travels its own route. The three routes are configuration polling (how the gateway learns its rules), the prompt and response request path (the live AI traffic itself), and the observability pipeline (the operational data recorded about that traffic). Keeping them separate means a configuration update, a live AI request, and a telemetry export never share a channel, which makes the system easier to secure, to reason about, and to operate.
A data flow is a category of information that moves between two points in a predictable direction: from where it is produced to where it is consumed.
These flows cross the two halves of Agent Router (the data plane and the management plane) that are introduced in Planes and core components. The essentials are restated here so this page can be read on its own.
The two places data moves between
- The data plane is the part of Agent Router that handles all live AI traffic: every prompt and every response passes through it, and nowhere else. Its central component is the AI Gateway, the server that every request travels through on its way to a provider. Where the data plane runs depends on the deployment model: in Self-Hosted Data Plane it sits inside the customer's own Kubernetes cluster (Kubernetes is the industry-standard system for running containerized software); in fully hosted paths (Service or Enterprise Fully Managed), Tetrate operates it. The three paths are compared in Deployment models.
- The management plane is hosted and operated by Tetrate in every deployment model. It stores all configuration (routing rules, policies, provider settings, user accounts) and exposes the two web applications used to manage Agent Router. No live AI traffic ever passes through the management plane.
A provider is a service that hosts large language models, for example OpenAI, Anthropic, Google, Azure, Amazon, or Perplexity. A large language model (LLM) is an AI model that takes a piece of text (a prompt) and returns generated text (a response).
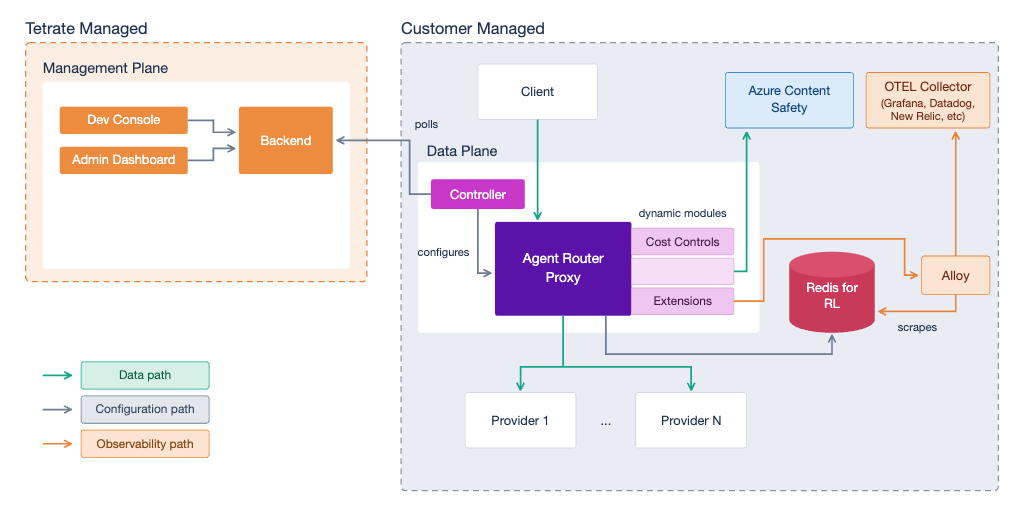
The diagram below shows all three flows spanning both planes for Enterprise Self-Hosted Data Plane, where the data plane runs in the customer's environment (Customer Managed) and Tetrate hosts only the management plane. Fully hosted deployments keep the same three flows, but the data plane sits in Tetrate's environment instead.
Configuration flow: how the gateway learns its rules
The configuration flow carries the rules the gateway needs to do its job: which providers exist, which models are available, how requests should be routed, what spending and content policies apply, and which credentials to use. Those rules are decided and stored in the management plane, but they have to reach the gateway in the data plane before they can take effect.
This is handled by the Controller, a component that runs alongside the gateway in the data plane and acts as the bridge between the two planes. The Controller performs configuration polling: on its own timer, rather than waiting for the management plane to push updates, it asks the management plane for the latest configuration and receives whatever has changed. Once it has the update, the Controller translates it into settings the gateway understands and applies them, keeping routing rules, policies, and credentials current.
The connection is outbound only: the data plane always initiates the connection out to the management plane, and the management plane never initiates a connection the other way. In Self-Hosted Data Plane deployments that means the customer's firewall (the network barrier that controls what may enter and leave their environment) needs no inbound openings for Agent Router at all. A firewall that only has to allow outbound connections is simpler to approve, and it reduces attack surface: the number of ways an outside party could try to reach into the environment.
The data plane also keeps working if the connection to the management plane is briefly interrupted. It continues routing requests using the configuration it already holds, and it picks up any changes on the next successful poll.
The Controller and its role as the bridge between the planes are described further in Planes and core components.
Request flow: the live prompt and response traffic
The request flow is the live AI traffic itself, and it is the flow that carries the actual content of prompts and responses. Requests originate from client applications (the programs an organization runs that need to call an AI model), pass through the gateway, and are forwarded to the selected provider. Responses travel the same route in reverse.
Along the way, the gateway does several things to each request in turn, all inside the data plane:
- It authenticates the request and identifies which caller it belongs to, using the API key the request carries. An API key is a credential that names and authorizes the caller.
- It applies routing decisions: choosing which provider and model should serve the request, based on the configuration delivered by the configuration flow.
- It enforces rate limiting. A rate limit is a cap on how many tokens a given key may consume per hour (a token is the unit of text that LLMs measure work in, roughly a few characters each). Rate limiting protects both the provider and the customer's budget from a single caller sending far more traffic than intended.
- It applies guardrails. A guardrail is a content rule enforced inline on model traffic, for example removing personally identifiable information from a prompt or blocking a disallowed request. Guardrails can inspect the response on the way back as well. They do not evaluate standalone MCP profile traffic.
- It attaches the correct provider credential and forwards the request to the chosen provider. If that provider fails or is unreachable, the gateway can walk to the next backend in a configured fallback order, within the same request, with no action needed from the application.
The defining property of this flow is that it never passes through the management plane. In Self-Hosted Data Plane deployments, prompt and response content (which can include proprietary code, customer records, or internal documents) also stays inside the customer's network boundary, leaving it only to reach the provider selected to serve the request, because the gateway runs in infrastructure the customer controls. In fully hosted deployments the content still never reaches the management plane, but Tetrate operates the data plane. Keeping live content off the management plane is the central reason Agent Router separates the planes at all.
What happens to a request inside the gateway is covered step by step in Guardrails, and the gateway's normalized errors and per-request identifiers are documented in Gateway behavior.
Observability flow: the operational record of traffic
The observability flow carries the operational record of what Agent Router is doing, so that it can be watched, measured, and alerted on. It carries facts about the traffic, never the payloads on the request path, with one exception: a guardrail trigger record can carry the matched excerpt to the management plane, governed by the Admin Console's Settings → Guardrails content mode. Three kinds of data travel this flow:
- Telemetry is the general term for operational data recorded about traffic, such as latency (how long a request took), token counts, cost, and the outcome of each request.
- Metrics are numeric measurements aggregated over time, such as total requests, error rates, and latency percentiles. Metrics are the raw material for dashboards and alerting rules.
- Structured logs are individual event records in a consistent, machine-readable format, so that tools can search and correlate them rather than parsing free text.
The flow is assembled from two stages. First, a Grafana Alloy agent running locally in the data plane collects the observability data. Grafana Alloy is an open-source collector: an agent that scrapes (periodically pulls) data from the components that produce it, in this case the gateway, the Controller, and the Redis instance the gateway uses for rate-limit counting. Second, the collected data is forwarded to an OpenTelemetry (OTel) Collector. OpenTelemetry is an open, vendor-neutral standard for describing and transporting telemetry; the OTel Collector is a routing hub that receives telemetry in that standard format and forwards it onward.
From the OTel Collector, the telemetry is routed to whichever monitoring backends the organization already runs. A monitoring backend is a platform that stores telemetry and turns it into dashboards, searches, and alerts. Common examples are Grafana (open-source dashboards and visualization), Datadog (a hosted monitoring platform), and New Relic (a hosted observability platform). Because Agent Router emits telemetry in the open OpenTelemetry format rather than a proprietary one, it slots into the tooling an observability team already operates, instead of forcing a second, separate console.
The point of this two-stage design (a local collector that scrapes, feeding a collector that routes) is that Agent Router does not decide where telemetry ultimately lives: storage, retention, and alerting rules stay with the destination platform rather than inside Agent Router.
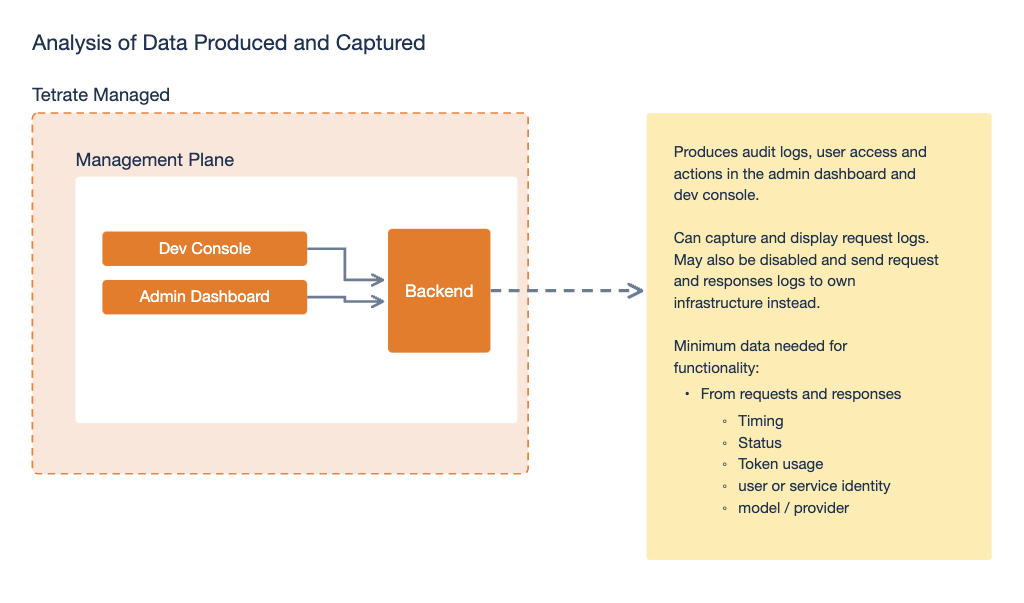
The operational detail of reading this data lives in Monitor traffic and usage (the in-Console surfaces) and Export telemetry to an observability stack (sending it to an external backend). The exact metrics and span attributes are listed in OpenTelemetry metrics.
The three flows at a glance
The flows differ in direction, in what crosses them, and in who consumes the result. No single channel mixes configuration, live content, and operational data, so each can be secured and scaled on its own terms.
| Flow | Direction | Carries | Consumed by | Why it is separate |
|---|---|---|---|---|
| Configuration | Data plane to management plane, outbound only | Policy, routing, and credential updates | The Controller, which applies them to the gateway | Keeps the gateway in sync; in Self-Hosted, with no inbound connections into the customer environment |
| Request | Client to gateway to provider, and back | Prompts and responses (sensitive content) | The client application, via the provider | Isolates live content on the data plane so it never touches the management plane |
| Observability | Data plane to the organization's monitoring backends | Telemetry, metrics, structured logs | Grafana, Datadog, New Relic, and similar | Lets existing monitoring tools absorb operational data without carrying live traffic |
Where to go next