Monitor traffic and usage
The hardest part of running AI in production is rarely the first request. The hard part is what happens later: an unfamiliar bill at the end of the month, a sudden latency regression that no application change explains, a quiet drift in which model is actually serving a particular path, a key that has started sending traffic from somewhere it should not. Two complementary surfaces in the Console make monitoring easy: Request Logs is the per-request record of every gateway call, and Usage Analytics is the aggregate view of total requests and spend, broken down by model, provider, and API key. This guide covers when each surface is the right one, how the API-key-per-purpose pattern makes both of them dramatically more useful, and the most common monitoring workflows.
Persona: Developer working in the Agent Router Console.
Estimated time: 10--15 minutes for an initial tour of both surfaces; ongoing thereafter.
When this guide applies
The monitoring surfaces are useful whenever AI traffic is flowing. The guide is especially relevant in three recurring situations:
| Situation | Surface that helps most |
|---|---|
| Debugging a specific bad request | Request Logs |
| Verifying that a fresh integration is wired correctly | Request Logs |
| Understanding cost trends and projecting future spend | Usage Analytics |
| Comparing the volume served by two backends in a traffic split | Usage Analytics |
| Detecting an unexpected usage spike on a specific API key | Usage Analytics, then Request Logs to drill in |
For programmatic access to the same data (exporting to a long-term observability stack, building external dashboards, or alerting), the Export Telemetry to an Observability Stack guide is the right next step.
Outcomes
By the end of this guide:
- The Request Logs and Usage pages have both been opened and the available filters exercised.
- At least one request has been located in Request Logs and its detail panel reviewed.
- Usage Analytics has been filtered by API key and inspected for the model and provider breakdown.
- The API-key-per-purpose pattern is understood as the way to make both surfaces precise rather than blurry.
Prerequisites
- A working API key with at least a few requests of recent traffic against it, as set up in Route Requests Across Providers and exercised through any of the earlier guides.
- Optional but recommended: a second API key created for a different purpose (Playground, an SDK integration, an experimental routing configuration), so the API-key filter is meaningful rather than degenerate.
Step 1: find a specific request in request logs
Request Logs is the closest the platform comes to a single source of truth for what actually happened on any given call. Each row corresponds to one request, in reverse chronological order.
-
Sign in to the Console.
-
Open Monitoring → Request Logs from the sidebar.
-
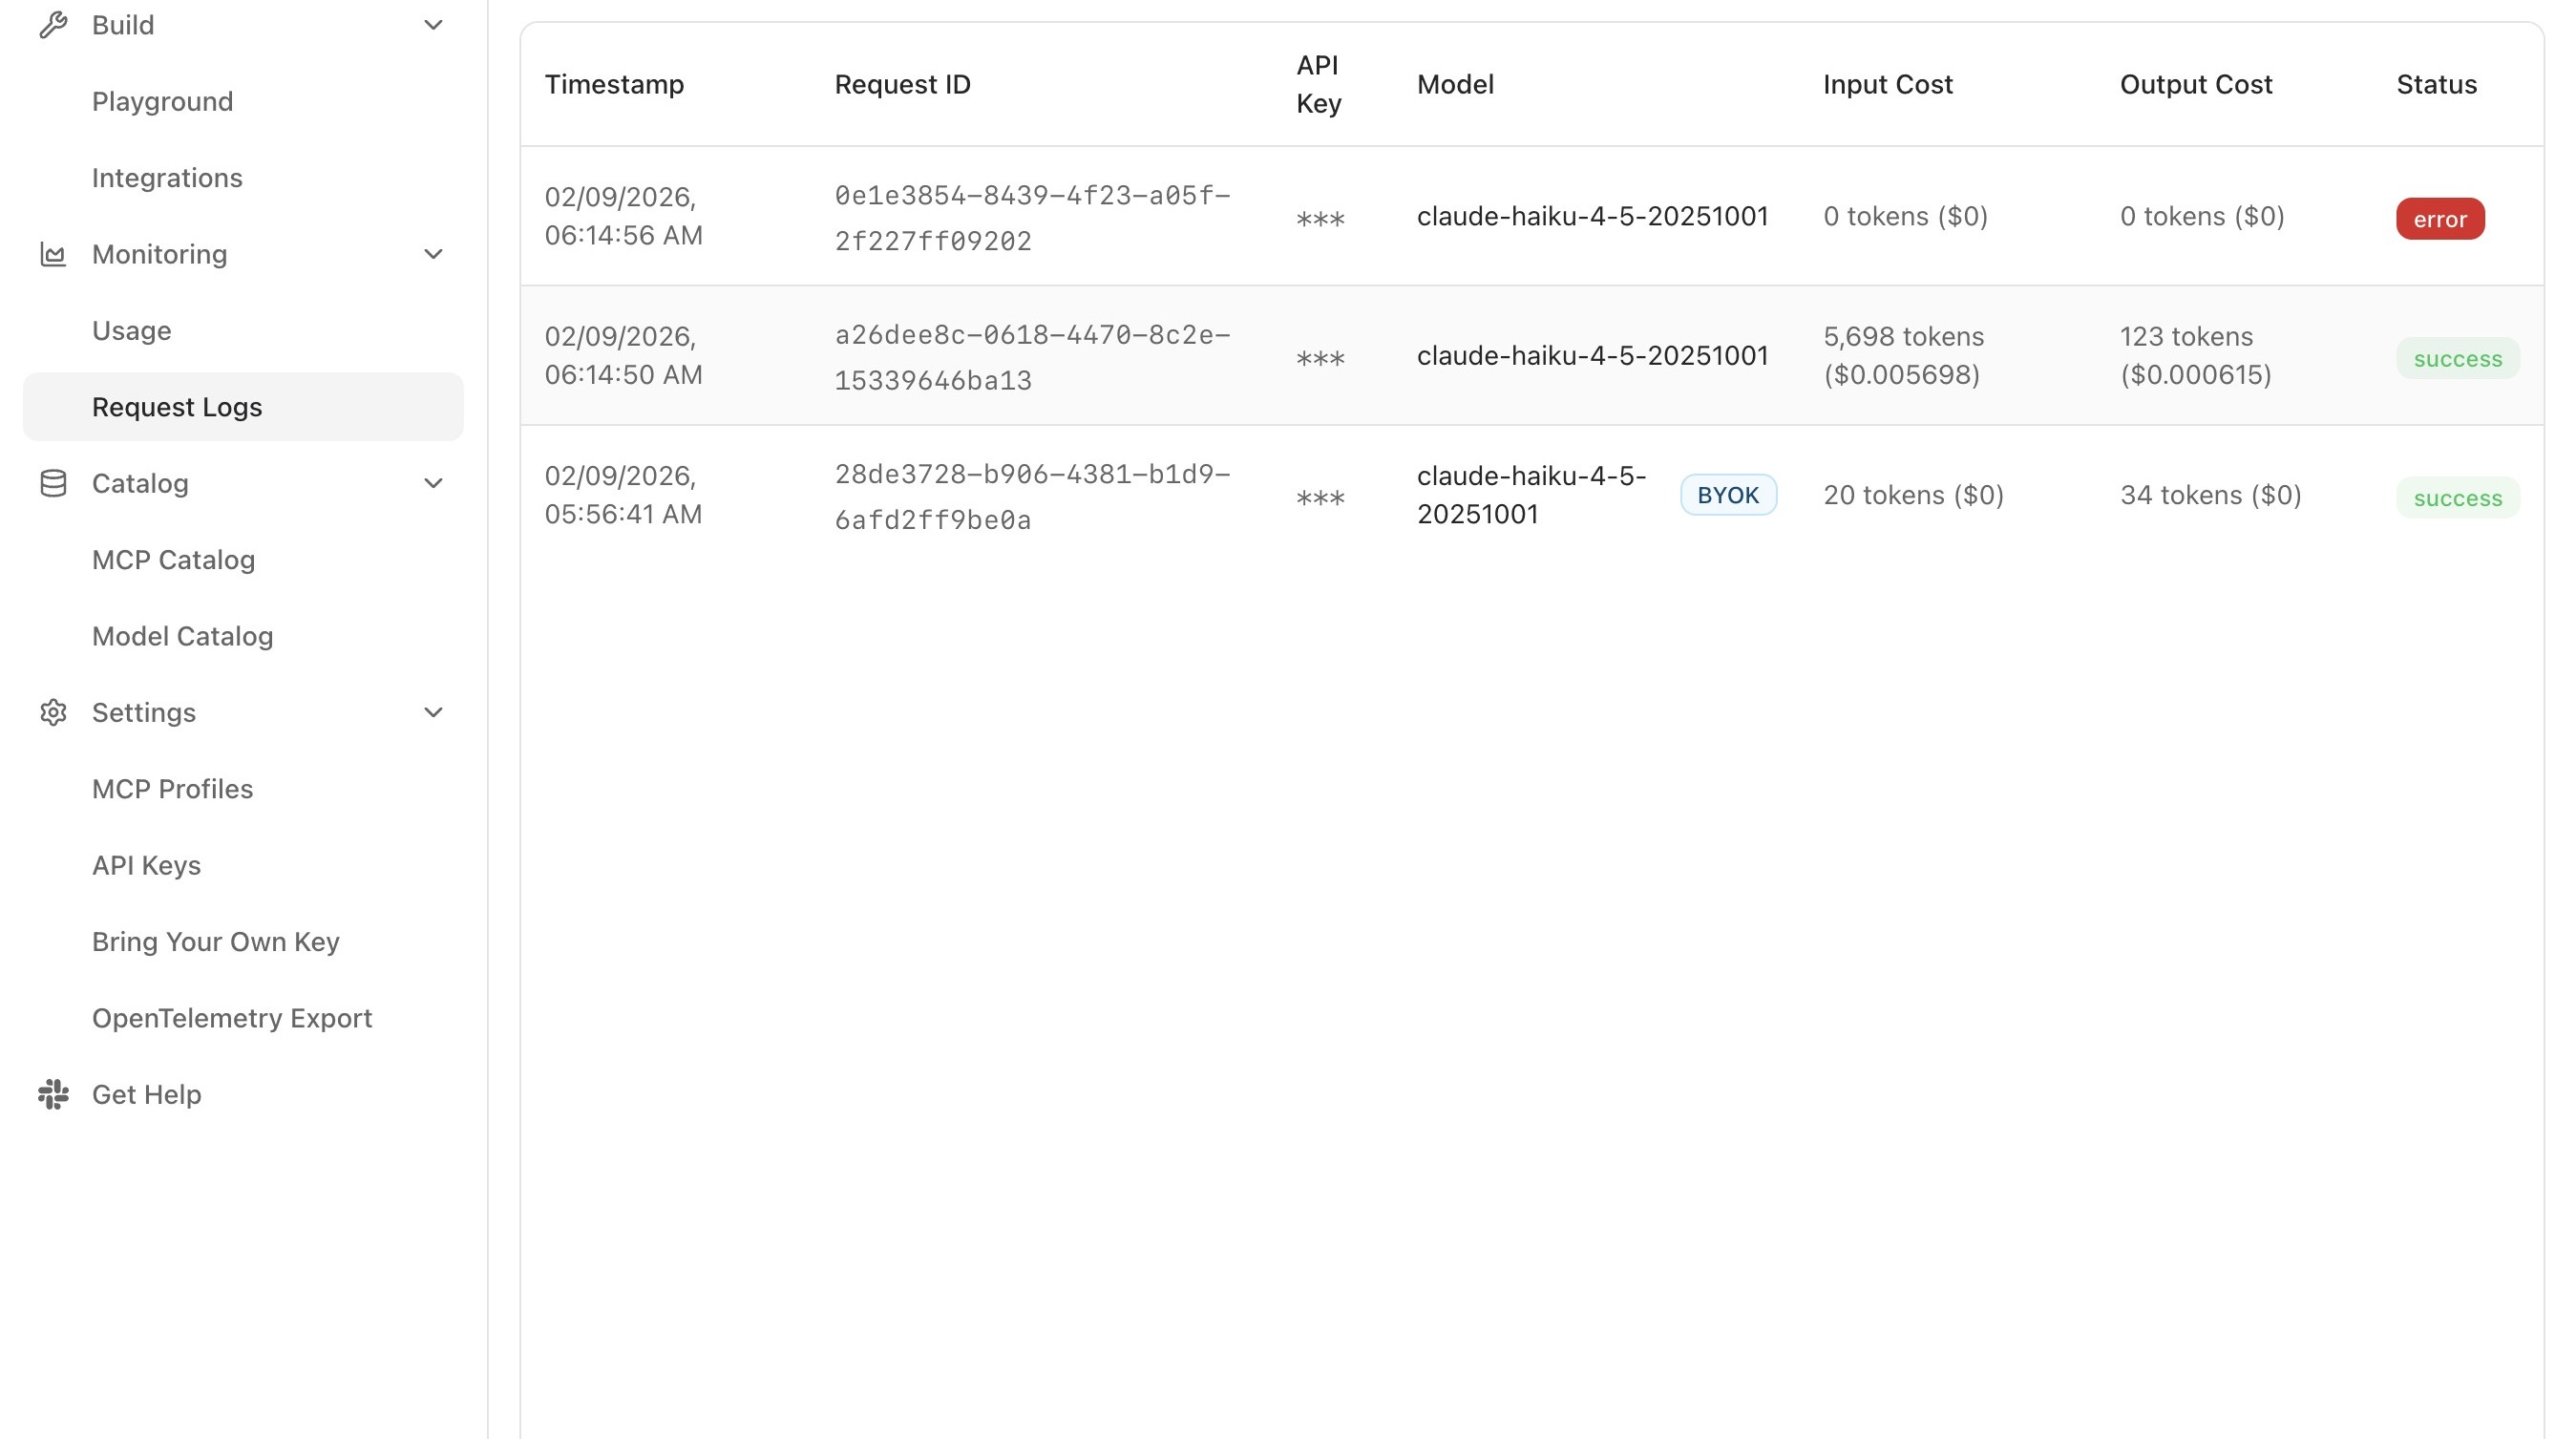
The table shows every recent request, with the following columns:
Column What it captures Timestamp When the gateway received the request Model The model that handled the request, the resolved model, after routing decisions are applied Tokens (Input) / Tokens (Output) Token counts attributed to the request Cost Computed from the resolved model's pricing and the token usage Latency End-to-end time the gateway observed for the call Status HTTP status code ( 200for success;429for rate limit;5xxfor failure) -
Narrow the view using the available filters:
- Text search finds requests by content keyword.
- API key filter isolates traffic from one integration or team member.
- Time-range filter preset windows of 1h, 24h, 7d, 30d, or 90d.
-
Click any row to open the request's detail panel, which contains:
- The request headers (with the API key masked).
- The full request body, including model, messages, and parameters.
- The full response body.
- A token-by-token breakdown of input and output.
- The cost calculation, derived from the model's per-token pricing.
- A latency breakdown: time-to-first-token and total response time.
- Status and any error message, if the call failed.
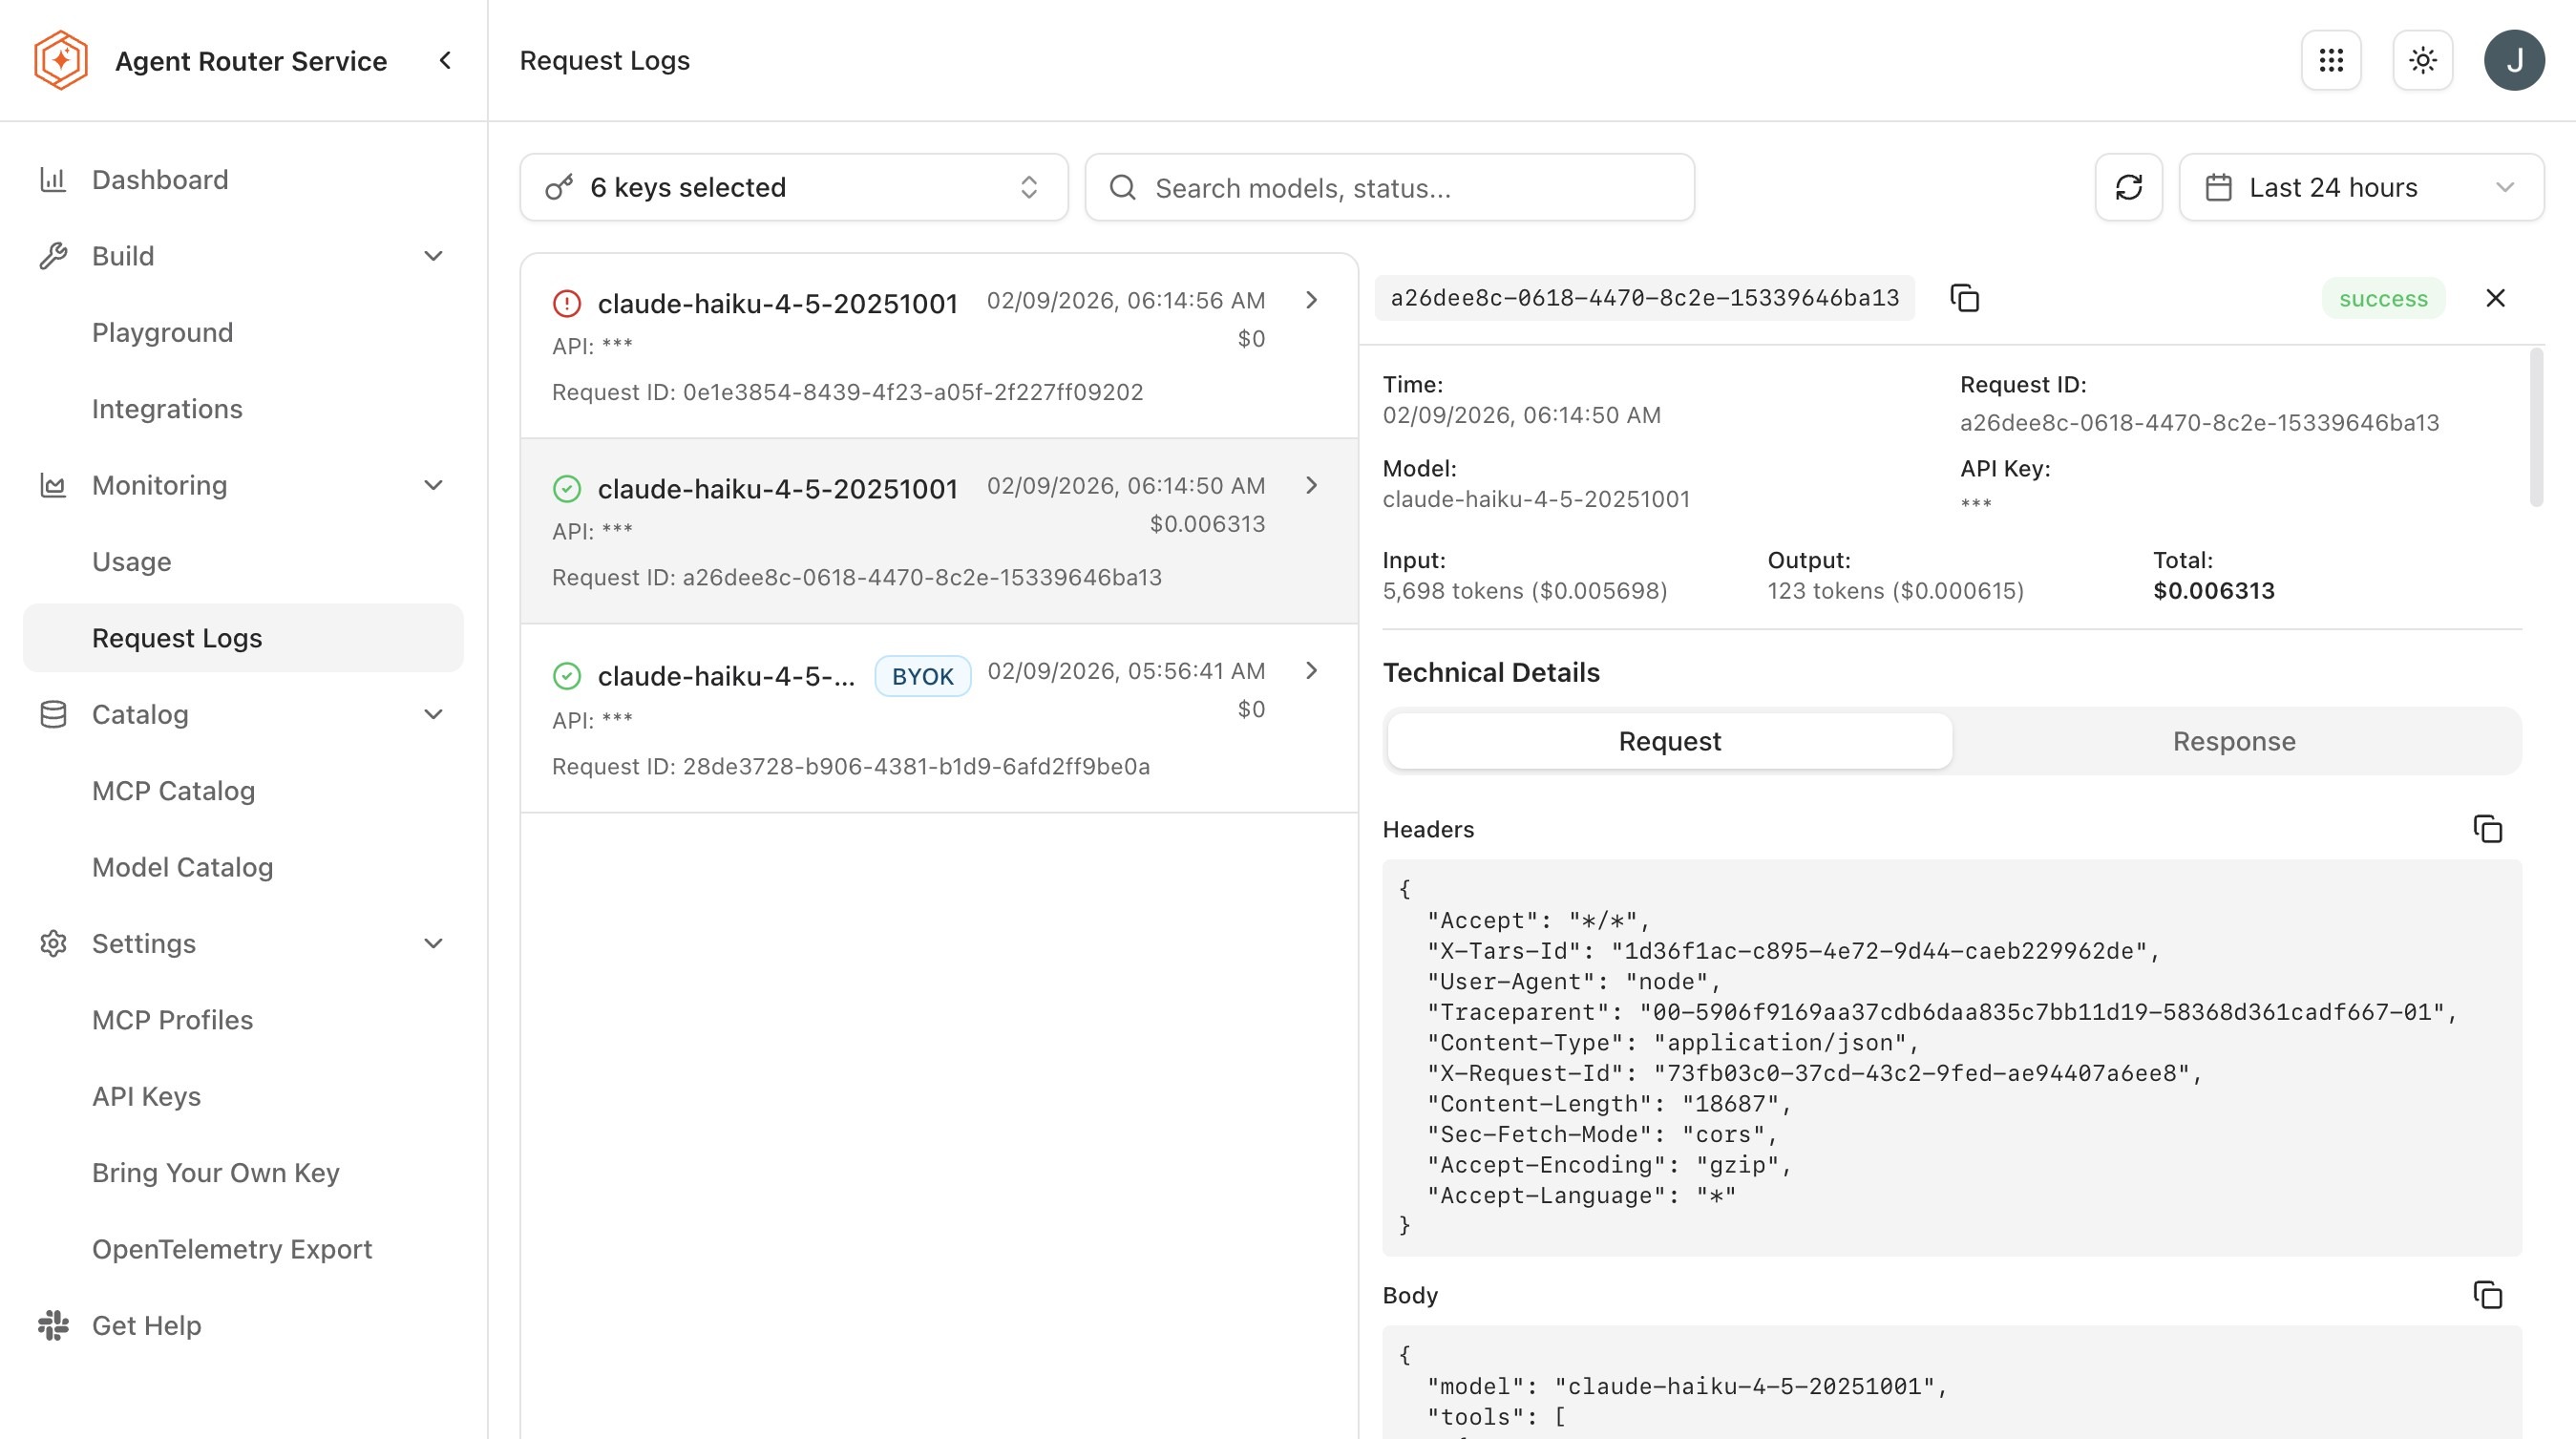
The detail panel is the level of granularity that settles most debugging questions: did the request reach the gateway, which backend handled it, what exactly did the model see, what exactly did the model return, and how long did it take.
When the result set exceeds a single page, the pagination controls at the bottom of the table page through the remaining requests at a fixed number of rows per page.
To debug a request that failed rather than verify one that succeeded, the table is best read from its status column inward:
- Set the time-range filter to the window in which the failure occurred.
- Scan for rows whose status is not
200. - Open the row and read the error message in the response body, alongside the status code, to determine the cause.
The Cost column is also the quickest way to attribute spend at the per-request level: with the API-key filter applied, the cost of each individual request made with that key is visible directly in the table. For aggregated cost across many requests, Usage Analytics is the better surface.
Step 2: verify an integration in request logs
A typical use of Request Logs is to confirm that a freshly-configured integration is doing what its author expected.
-
Issue at least one request from the integration: a Playground exchange, an SDK call, a tool invocation through an MCP profile, or an editor extension talking to the gateway.
-
Switch to Monitoring → Request Logs in the Console.
-
Filter by the API key the integration is using.
-
Locate the request in the table.
-
Confirm three things in the detail panel:
- The resolved model matches what was expected. If a routing policy is in play, the resolved model might differ from the one the application asked for; both values are visible.
- The status is
200. A429typically indicates rate limiting on an upstream provider;5xxindicates an upstream failure. - The request body matches what the integration intended to send. Prompt templating bugs are the most common cause of "the model is misbehaving" reports, and they are immediately obvious here.
If the integration is producing no log entries at all, the problem is almost always on the integration side: a wrong base URL, a missing API key, or a network configuration issue. The gateway logs everything it sees; absence of a log entry means the request never arrived.
Step 3: look at aggregate behaviour in usage analytics
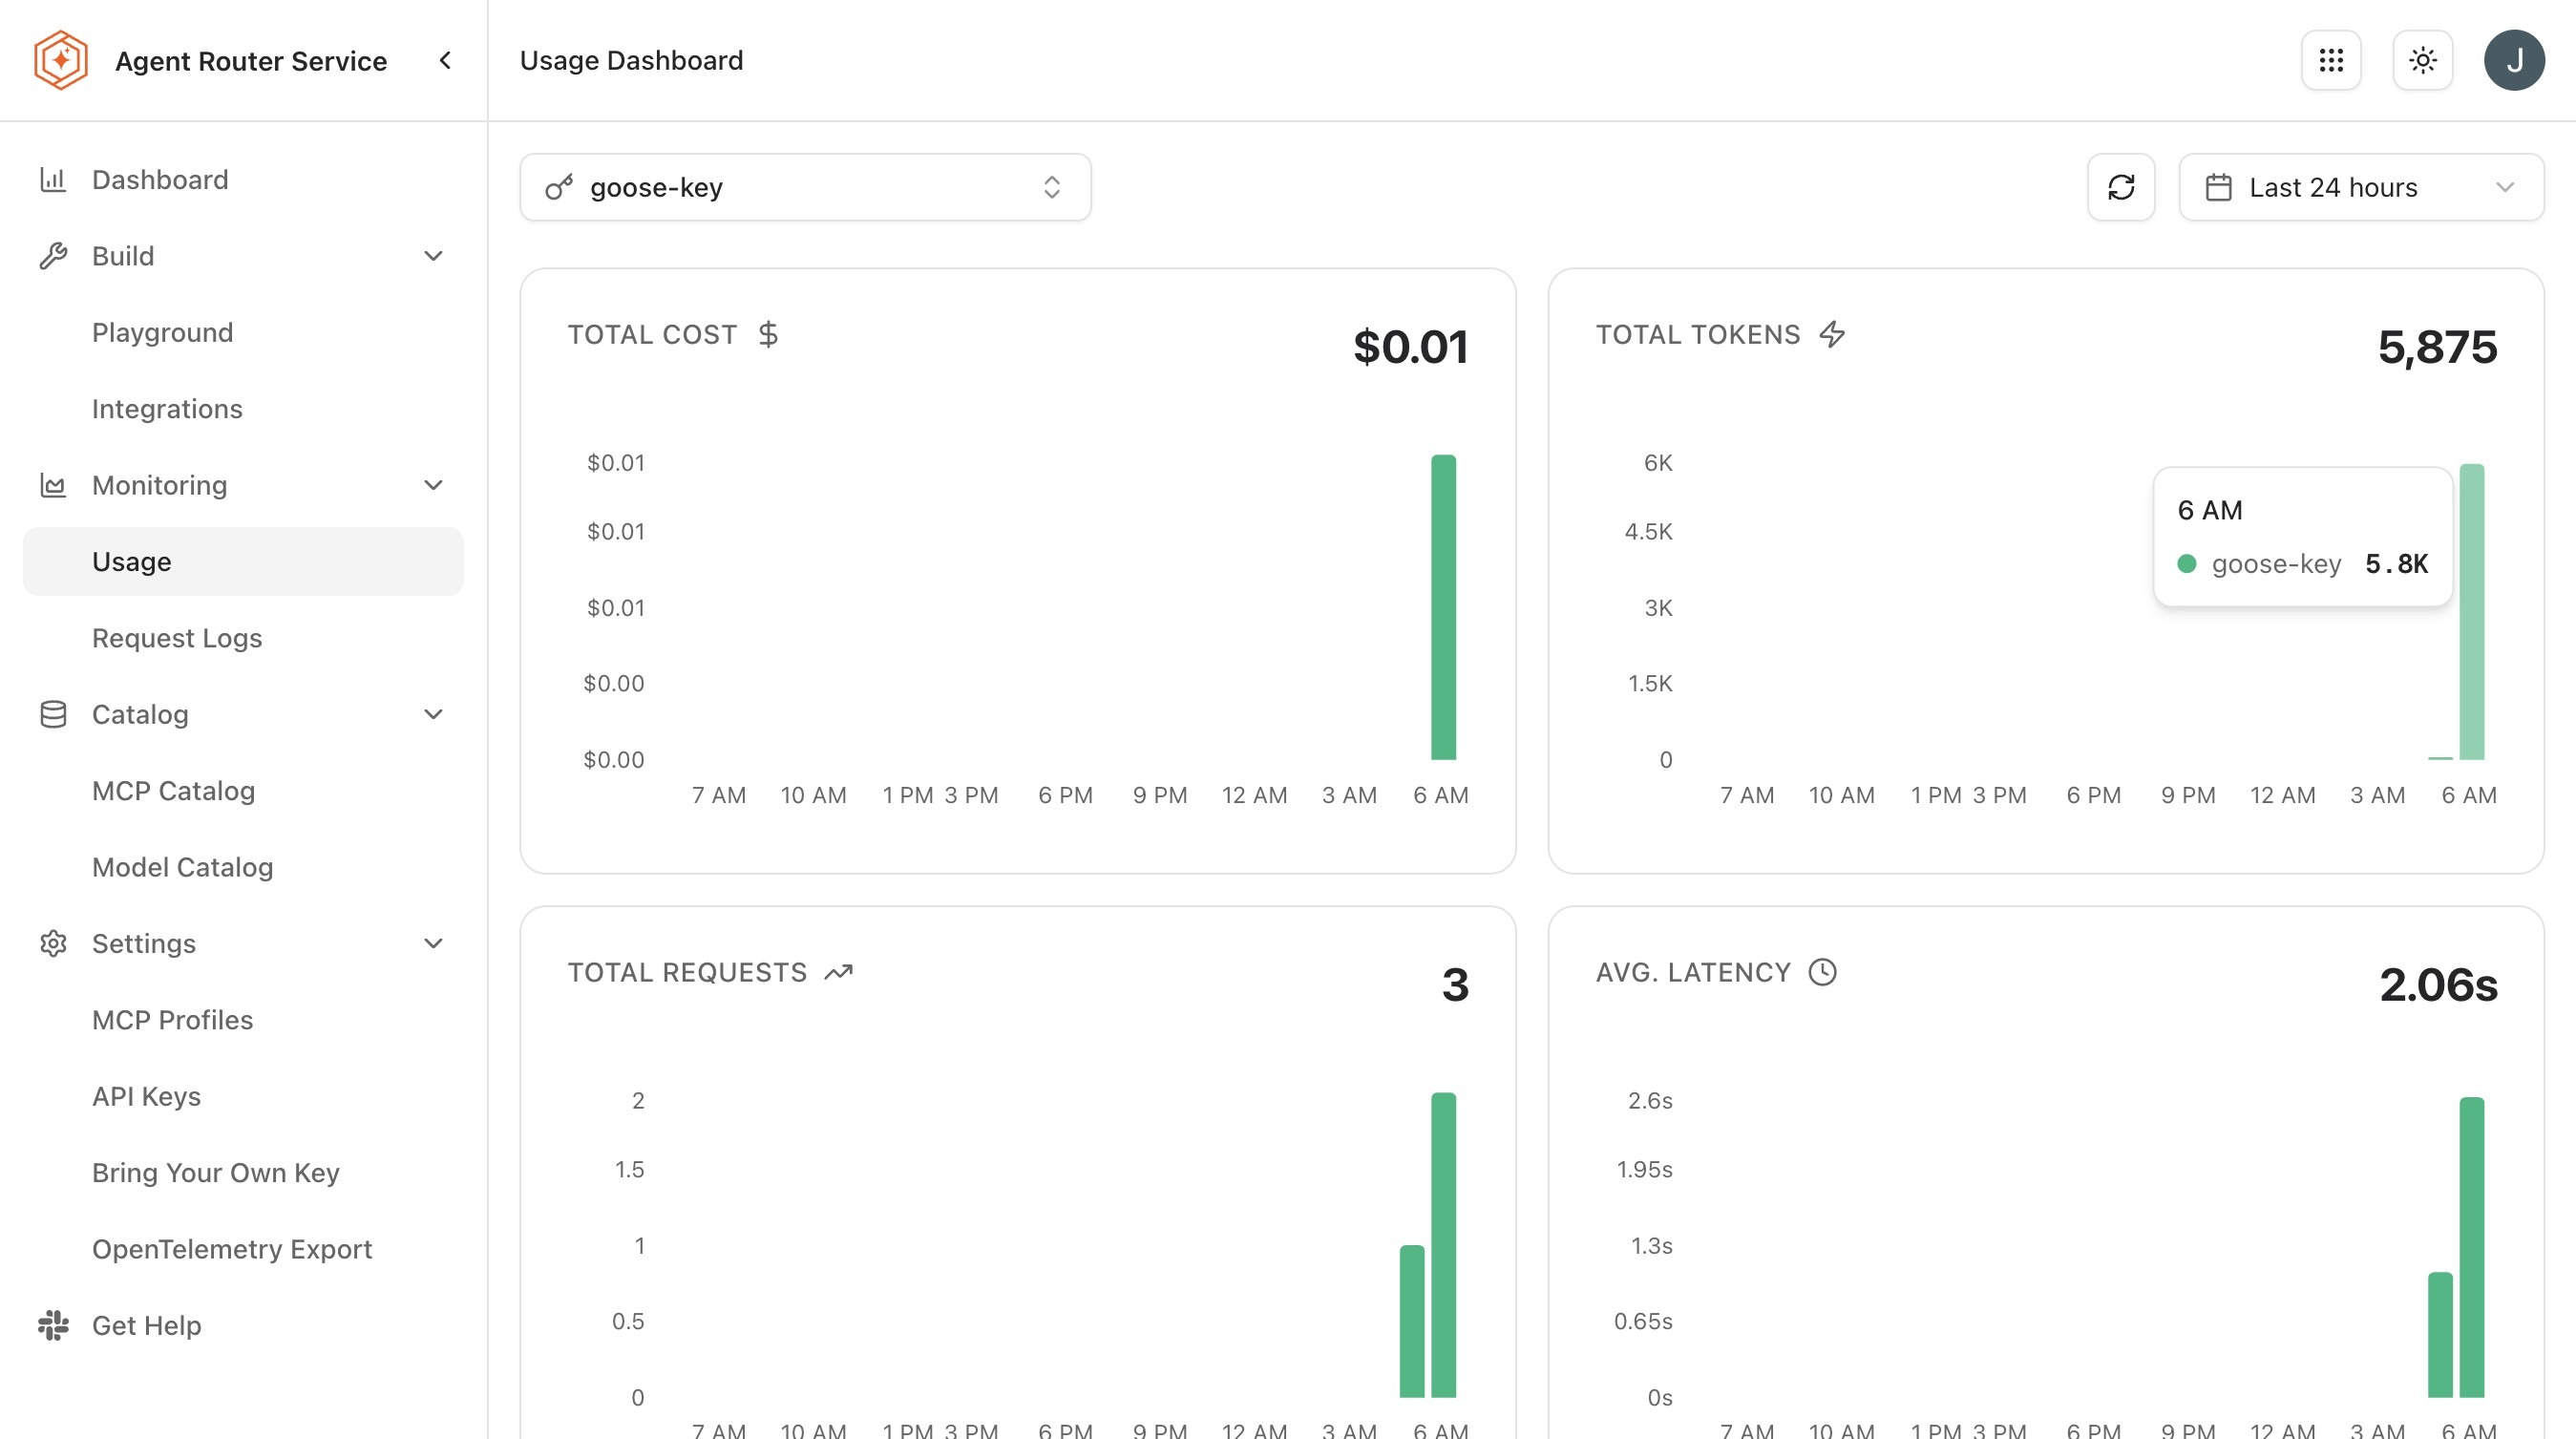
Where Request Logs answers "what happened on this specific call", Usage Analytics answers "what is the overall picture across many calls". The page surfaces two summary metrics (Total Requests and Total Spend) and a set of breakdowns.
-
Open Monitoring → Usage from the sidebar.
-
Select a time range. Last 24 hours, Last 7 days, Last 30 days, and Last 90 days are typical presets.
-
Read the summary cards at the top of the page for an at-a-glance picture of activity.
-
Scroll through the available breakdowns:
Breakdown What it shows Usage trends over time A time-series of request volume and cost across the selected window Requests by model How many requests were routed to each model, surfacing which models the workload actually leans on Cost breakdown by provider Total cost attributed to each provider, showing which provider is driving spend -
Apply the API key filter to restrict every panel on the page to a specific key. When no filter is applied, every panel reflects all API keys combined.
The filter is what turns the page from a single number per organisation into a per-integration, per-team, or per-experiment view. The pattern that makes this work is covered in Step 4.
The breakdowns also support three interpretive uses beyond reading the current numbers:
- Cost optimisation: the cost-by-provider and requests-by-model breakdowns reveal where spend concentrates. Where a less expensive model can serve the same use case, the API key's routing configuration can be updated to prefer it, or traffic splitting can be used to shift load gradually.
- Capacity planning: the usage-trends chart projects future request volume. Where usage is growing, the administrator can be engaged to confirm that provider rate limits and budgets remain sufficient.
- Key hygiene: a key showing unexpected usage may indicate a leaked credential or a misconfigured integration. Such a key can be revoked and a replacement issued.
Step 4: issue one API key per purpose
Almost every interesting question that can be asked of the monitoring surfaces becomes trivially answerable once each distinct concern has its own API key. A few examples:
- "How much is the production checkout service spending on AI this month?" trivial if
checkout-service-prodis its own key. - "Which integration produced this surprising spike?" trivial if Playground, each SDK integration, and each CI job have separate keys.
- "How does the latency on the canary model compare to the baseline?" trivial if the canary route is isolated on its own key.
- "Was this leaked credential used anywhere I should worry about?" trivial if the leaked key is one of several, scoped to a narrow purpose, and easy to revoke.
The pattern is cheap to set up (new keys are issued from the Console in seconds) and pays for itself the first time a question about traffic needs a precise answer rather than a guess. Conversely, a single platform-wide key that everything uses turns every monitoring question into a forensic exercise.
Practical conventions that work well:
- Name keys for their purpose, not their owner (
checkout-service-prod,rag-experiment-staging,ci-evaluation-runner) because the name appears in every monitoring view. - Issue separate keys for production, staging, development, and Playground use within the same application.
- Rotate keys when their purpose changes substantially; do not stretch a single key across two unrelated workloads.
The detailed lifecycle for API keys (creation, naming, revocation, and rotation) is documented at Route Requests Across Providers.
Step 5: use the two surfaces together
Request Logs and Usage Analytics are designed to be used together. A typical investigation flow:
- Notice an anomaly on the Usage page: an unexpected spike, an unfamiliar model in the by-model breakdown, or an unusual provider cost.
- Filter the Usage page by API key to identify which key is responsible.
- Switch to Request Logs.
- Apply the same API-key filter and a time range covering the anomaly.
- Inspect specific requests to confirm what is actually happening at the per-request level.
The reverse direction also works. A puzzling individual request seen in Request Logs is sometimes obvious in context once the surrounding traffic is viewed at the aggregate level: a single 429 in isolation looks like a fluke, while a 429 plus a cluster of latency spikes during the same minute looks like a provider incident.
What to do next
- Export telemetry to an observability stack: send the same data into the organisation's existing dashboards, alerting, and long-term storage. See Export Telemetry to an Observability Stack.
- Apply advanced routing rules: use the by-model breakdown in Usage Analytics to evaluate A/B and canary deployments. See Apply Advanced Routing Rules.
- Reduce cost with traffic splitting: watch the cost-by-provider breakdown evolve as splits are tuned. See Reduce Cost with Traffic Splitting.
Where to go next